Related Categories
Related Articles
Articles
India (GDP 2000 - 2016)
The statistic shows the gross domestic product (GDP) per capita in India from 2000 to 2016:
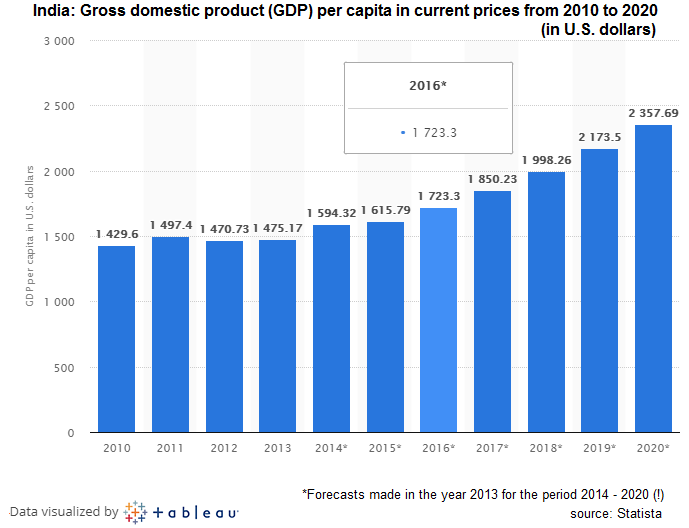
The projections up until 2020 are shown in the next graph (see below). As can be seen in both graphs (but different sources) in the year 2013, the estimated gross domestic product per capita in India amounted to about 1,450 to 1,475 U.S. dollars.
India's economic progress
India's progress as a country over the past decade can be attributed to a global dependency on cheaper production of goods and services from developed countries around the world. India's economy is built upon its agriculture, manufacturing and services sector, which, along with its drastic rise in population and demand for employment, led to a significant increase of the nation's GDP per capita. Despite experiencing rather momentous economic gains since the mid 2000s, the Indian economy stagnated around 2012, with a decrease in general growth as well as the value of its currency.
In the more recent past, the Indian subcontinent picked up economic momentum again and is growing faster than its even bigger neighbour China.
Typical Indian exports consist of agricultural products, jewelry, chemicals and ores. Imports consist primarily of crude oil, gold and precious stones, used primarily in the manufacturing of jewelry. As a result, India has seen a rather highly increased demand of several gems in order to boost their jewelry industry and in general their exports. Although India does not export an extensive amount of goods, especially when considering the stature of the country, India has remained as one of the world's largest exporters.


