Related Categories
Related Articles
Articles
Global Exports
The following table shows revised trade projections for 2015 and 2016, which depend on consensus estimates of world real GDP growth at market exchange rates. Important to know, that EM-exports tend to correlate with returns from EM-investments:
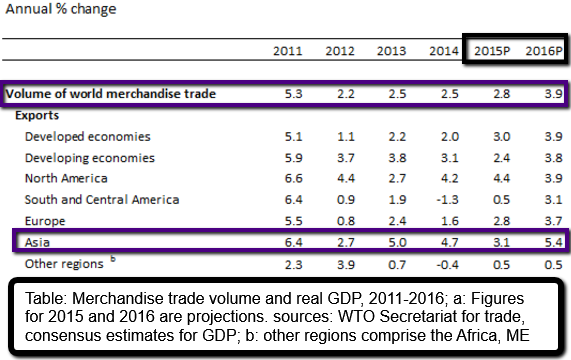
The WTO now expects world merchandise trade volume as measured by the average of exports and imports to grow 2.8% in 2015 and 3.9% in 2016. On the export side, shipments from developed economies should rise 3.0% this year and 3.9% next year. Developing economies' exports are expected to grow more slowly at 2.4% in 2015 and 3.8% in 2016. Imports of developed economies should increase at around the same rate in 2015 (3.1%) and in 2016 (3.2%), while those of developing economies pick up from 2.5% in 2015 to 5.2% in 2016.
The strongest downward revision to the previous export forecast for 2015 was applied to Asia, where our estimate was lowered to 3.1% from 5.0% in April. This is mostly due to falling intra-regional trade as China's economy has slowed.
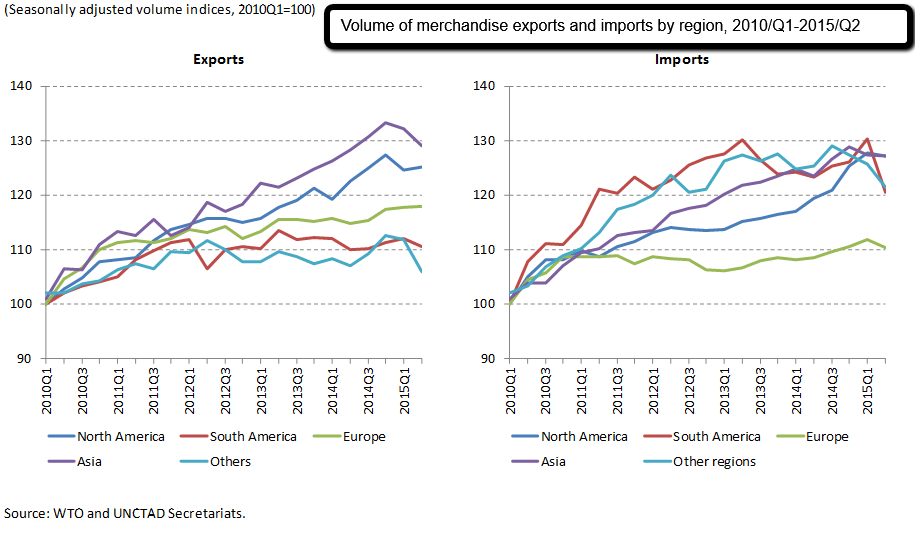
Trade growth remains uneven across countries and regions as illustrated by following Chart, which shows WTO merchandise trade volume indices by geographical region. After a long period of stagnation, Europe recorded the fastest year-on-year export growth of any region in Q2 at 2.7%, followed by North America (2.1%), Asia (0.6%), South and Central America (0.4%) and Other Regions (-1.0%, including Africa, the Commonwealth of Independent States and the Middle East). Disparities between regional growth rates was stronger on the import side than on the export side, with positive growth of 6.5% in North America, 3.1% in Asia and 1.6% in Europe, and declines of 2.3% in South and Central America and 3.1% in Other Regions.


