Related Categories
Related Articles
Articles
PMIs Global (Jan. 2017)
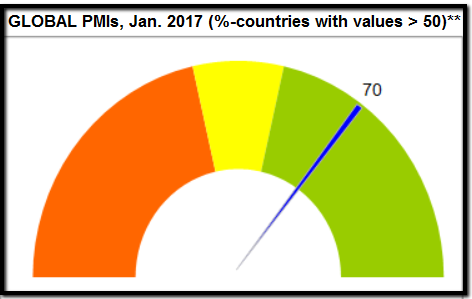
Global PMI-Status; Out of 47 countries/regions 33 countries carry a PMI reading > 50 (pos. reading), 33/47 = 70%**. Every year (around January) I am building my own Global-PMI-Tachometer Status.
Definition of 'Purchasing Managers' Index - PMI: An indicator of the economic health of the manufacturing sector. The PMI index is based on five major indicators: new orders, inventory levels, production, supplier deliveries and the employment environment.
Breaking Down 'Purchasing Managers' Index - PMI: A PMI of more than 50 represents expansion of the manufacturing sector, compared to the previous month. A reading under 50 represents a contraction, while a reading at 50 indicates no change. Prior to September 1, 2001, the acronym (PMI) stood for Purchasing Managers' Index.
Status Quo: Only 14 out of 47 regions/countries have a PMI-reading below 50 (contracting indication)** following the most recent data available as per Dec. 2016. These countries are following: Greece, South Korea, India, Indonesia, Malaysia, Myanmar, Egypt, Lebanon, Puerto Rico, Brazil, Hong Kong, Nigeria, South Africa and Turkey. This result (14/47) leads to the positive Tachometer-outcome of (33/47) = 70%.
From these 14 ("neg.") countries with a PMI-reading below 50, seven countries have experienced further deterioration versus the month before: India (49.6), Myanmar (49.4), Puerto Rico (47.9), Turkey (47.7), Malaysia (47.1), Brazil (46.2) and Egypt (41.8).
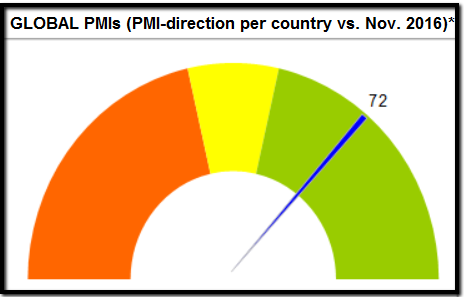
In the next tachometer one can see the development of the respective PMI-reading per country versus the month before*. As there were 34 upside developments versus 13 downside developments the result was a very positive figure of 72%. Therefore bringing the ratio of countries performing better than the month before up to over 2/3 (34/47 = 72%)!
data-source: www.tradingeconomics.com/country-list
The link above (tradingeconomics) displays a table with actual values, consensus figures, forecasts, statistics and historical data charts for - Manufacturing PMI - Countries - List. This page provides values for Manufacturing PMI reported in several countries. The table has current values for Manufacturing PMI, previous releases, historical highs and record lows, release frequency, reported unit and currency plus links to historical data charts.
Alternative view/Commenting on the J.P. Morgan-Survey of Global PMI, David Hensley, Director of Global Economic Coordination at J.P.Morgan, said: "The Global Manufacturing PMI edged up again in November 2016, reaching its highest level since August 2014. Output growth may have eased slightly, but the stronger trends in new order inflows and backlogs of work suggest that production will continued to rise at a solid pace in the near-term. Prices pressures are rising, however, as input cost inflation hit a five-year high to drive up average factory gate selling prices for a third month running."
J.P.Morgan Global Manufacturing PMI
Global Manufacturing PMI™ Summary
50 = no change on prior month.
Index Oct. 2016/Nov. 2016 +/– Summary:
Global PMI 52.0 52.1 + Rising, faster rate
Output 53.6 53.4 – Rising, slower rate
New Orders 52.8 52.9 + Rising, faster rate
New Exports 51.0 51.3 + Rising, faster rate
Employment 50.7 50.7 = Rising, same rate
Input Prices 55.3 58.5 + Rising, faster rate
Output Prices 52.7 53.5 + Rising, faster rate
J.P. Morgan: www.markiteconomics.com/Survey
PMI-definition: www.investopedia.com/pmi


