Related Categories
Related Articles
Articles
Dow Jones Industrial Average (inflation-adjusted)
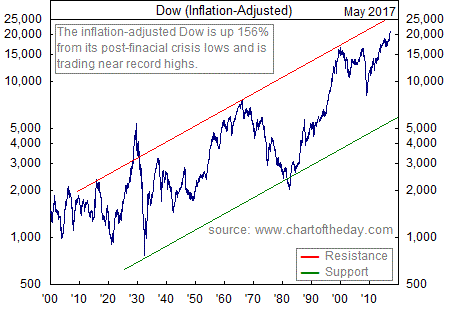
With the Dow continuing to trade above the 20,000 milestone, following chart provides some long-term perspective by illustrating the inflation-adjusted Dow since 1900 - there are several points of interest. Take for example an unlucky...

...buy-and-hold investor that invested in the Dow right at the dot-com peak of December 1999. A decade and a half later, the inflation-adjusted Dow is up a mere 25%. That is not altogether an impressive performance considering that 17 years have passed. On the other hand, take the investor who bought right at the end of the financial crisis: This investor is dancing Lambada since Q2-2009 with some "hickups" inbetween...
Overall, the inflation-adjusted Dow has been trending higher as it closes in on long-term resistance (see red line).


