Related Categories
Related Articles
Articles
Dow Theory (Charles Dow)
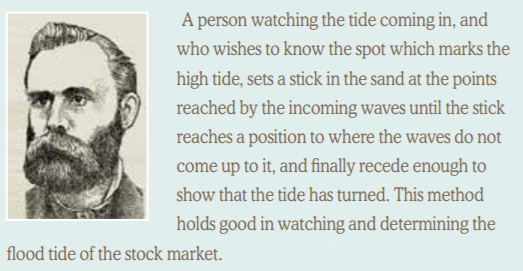
On 31st January 1901 Charles H. Dow compared the stock market to the tides of the ocean when he wrote in the Wall Street Journal:
If you think of the Dow Jones Industrial Average as being the measure of the tide on one part of the beach, and the Dow Jones Transportation Average as a measure on another part of the beach, both used to determine that the tide is indeed coming in or going out all along the seashore, rather than rogue waves in one place or the other, you will understand what Dow was getting at. Confirmation by both is an integral part of the Dow Theory.
Who is Mr. Dow?/just in a few words: Charles Henry Dow began his career as a reporter and developed an early interest in business. Subsequently, he and his friend Edward Jones formed Dow Jones & Company in 1882. They published the handwritten Customer’s Afternoon Letter, precursor of The Wall Street Journal, with Dow as its first editor.
The "definite theorems":
There are three movements of the averages. The first movement, and most important (!), is the primary trend. The second, and most deceptive is the secondary reaction. The third, and usually unimportant, is the daily movement. Both the Industrial and Transportation averages must confirm a trend. The determination of a major trend has come to be known as a signal to Buy or Sell, although Dow never called them such.
The classic Buy signal is developed as follows: After the low point of a primary downtrend in a Bear market is established, a secondary uptrend (this is the most often debated part of the Theory) bounce will occur. After that, a pullback on one of the averages must exceed 3%, according to Robert Rhea in his 1930's The Dow Theory, must then, ideally, hold above the prior lows on both the Industrial and the Transportation Averages. Finally, a breakout above the previous rally high by both, constitutes a BUY Signal for the developing Bull market.
The following chart represents how the Dow Jones Industrial Average and the Transportation Average might look:
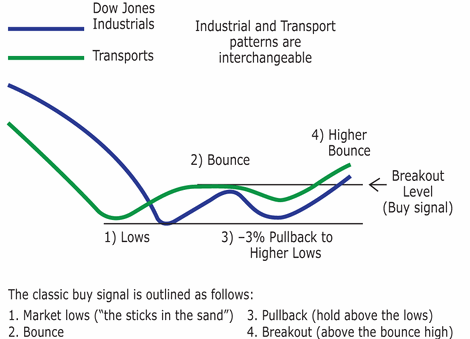
source: www.aaii.com/objects
A Bear market Sell signal is determined in much the same way, but opposite to a Buy Signal. When a Bull market tops and sets back, and the subsequent rally that goes back up (again, over 3%) and falls short of reaching the previous high and then penetrates the recent lows on the next decline as measured by both the Industrial and Transportation Averages, a SELL Signal is generated indicating a Bear market.
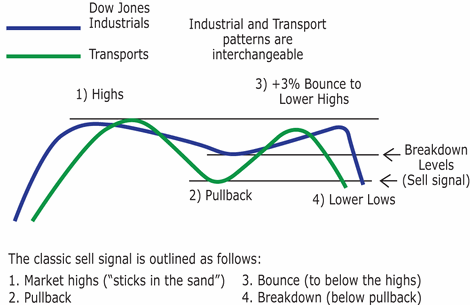
source: https://www.aaii.com/objects
BUT there are (many) other acceptable patterns...Other combinations of the above can occur with non-confirmations (divergence) at various points and still qualify as "signals".
"Easy-to-understand"-Signal: New all-time highs negate the need for pullbacks to confirm a new Buy.
Under the site "https://thedowtheory.com" it is mentioned, that on (and since then) the 19th April 2016 a BUY SIGNAL has been triggered according to the Dow-Theory-Rules at an Index-level of 18,054 points in the Dow Jones Industrial Average!
Final remark on the Dow-Theory Performance: Historically, the traditional Dow Theory has outperformed a buy-and-hold approach by 1% to 2% a year, a seemingly small percentage until one considers the compounding effect over a number of years, where the difference is substantial.
Medium-Term (Long-Term) view of the
♦ Dow Jones Transporattion Index (DJT) and the
♦ Dow Jones Industrial Average (DJIA), monthly updated (!):
links:


