Related Categories
Related Articles
Articles
Dow Jones Ind. Average (Fibos, Fear-levels)
A question we may want to explore is simply: "how big of a correction is coming?" A quick explanation on Fibonacci retracements in case you are unfamiliar from StockCharts.com: "Fibonacci Retracements are ratios used to identify potential...
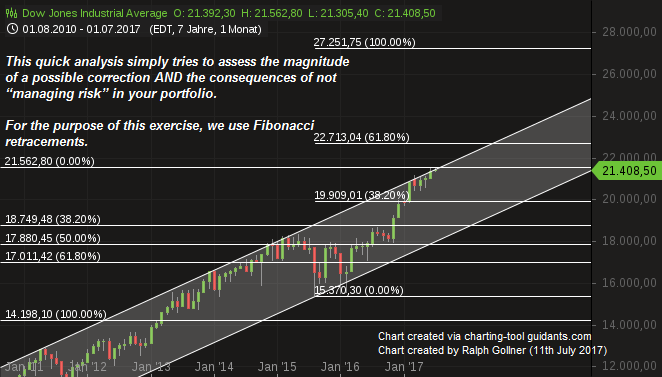
...reversal levels. These ratios are found in the Fibonacci sequence. The most popular Fibonacci Retracements are 61.8% and 38.2%. Note that 38.2% is often rounded to 38% and 61.8 is rounded to 62%. After an advance, chartists apply Fibonacci ratios to define retracement levels and forecast the extent of a correction or pullback."
If we expand our time frame to monhtly (see "monthly candlesticks" above) the picture comes out like the chart above. In the example given, the prior market peaks of 2000 and 2008 become critical support for the markets. 14.198 points in the DOW marked the Peak in the year 2007 !
Interesting enough, that the market reached intermediate lows in the years 2015 and 2016 (@ ca. 15.370 points, respective: 15.450 points in Jan. 2016). Let's recap: From 14.198 in the year 2007 to 15.450 points a performance of ca. + 10.8% excl. Dividends has been achieved - in that time period (HY2/2007 -2016: ca. 9 years...)...
Back to "correction mode": a correction to the first retracement level would in actuality be less than a normal bear market within an ongoing bull market trend.
A 38.2% retracement would be normal for a recessionary contraction. Even a 50% retracement would be "less worse" than what was seen during the previous two bear markets.
A correction down to the respective levels of (a) 18.750 or (b) 17.880 points in the Dow would be the equivalent to a down-market of:
(a) minus 13% from current levels
(b) minus 17%.
Be prepared, but don't be too scared !
cheers Ralph
Further info / same topic:
www.zerohedge.com/news/2017-07-05


