Related Categories
Related Articles
Articles
Dow Jones IA (inflation-adjusted)
Between the year 2000 and now (April 2016) Dow Jones-Investors did not gain much. My personal opinion: The investors in the two decades BEFORE 2000 have taken gains from the future!
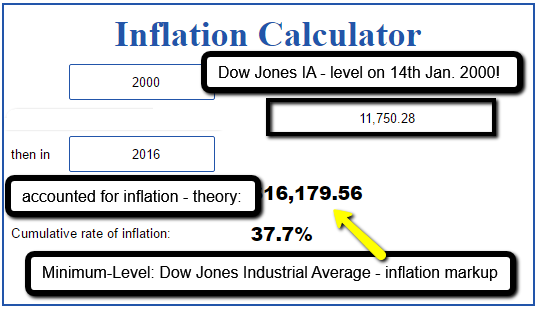 do your own calculations (e.g.) http://www.usinflationcalculator.com
hint: DJIA-level in the year 1984 +inflation-markup up to year 2000 (theory vs. reality)
Inflation-adjusted the Dow Jones Industrial Average did not really move the last 16 years (since the Boom-Peak in the year 2000). In the following chart a wrap-up of the period between 1970 and 2013 (DJIA then @ level of ca. 15k).

In the next chart one can see how the US-Stock Market in general performed on an inflation-adjusted basis again, since the time BEFORE the DJIA has even been created (1896). Great insight - the trend channel - from the year 1800 up until 2013:

links: http://www.safehaven.com/article/30537/inflation-takes-a-bite
inflation-calculator (online-tool): http://www.usinflationcalculator.com
Dow Jones Industrial Average year 2000 vs. year 2016 - article: http://www.advisorperspectives.com


