Related Categories
Related Articles
Articles
Net-Inflows GROWTH-SECTOR history/post-rate-hike history (Aug. 2015)
Taking a short step back and getting an overview about possible tactical allocations between asset-classes and sectors in the equities-universe it may be an idea to look further into the Tech- and Growth-Sector.
 source: www.thetradingreport.com/2015/04
Article on performance of different sectors AFTER a rate-hike-start: http://www.techandinnovationdaily.com
In the light of an upcoming rate-hike in the U.S. (whether it will be in Sep./Q4-2015 or even Q1-2016, etc.?) one should keep in mind that history might be a useful tool in helping to prepare a portfolio for a sudden jump or even a consistent rise of growth-stocks.
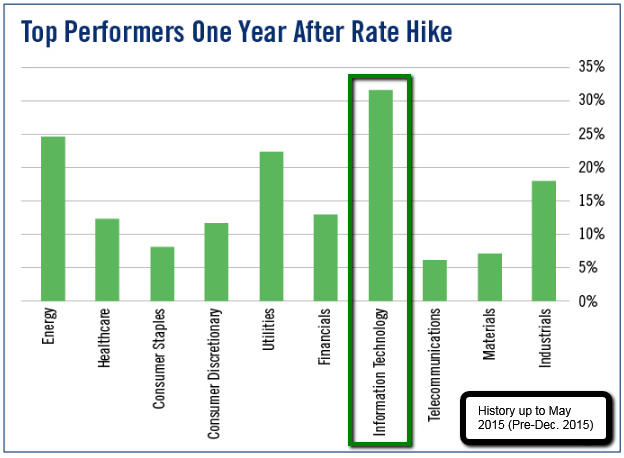
In the chart above one can see that first of all, the Tech-Sector may be least affected by rising interest rates. Two arguments for this possible development may be 1. the low debt-level in many growth-companies, rising rates therefore having less impact on their balance-sheets, and 2. that alternative sectors will vica-versa struggle more than tech handling rising rates (Industrials, etc.) - especially the second argument sounds logic, but not to all investors ; -)
techandinnovationdaily.com analyzed the 13 rising-rate environments we’ve experienced since 1946, Standard & Poor’s Sam Stovall found that technology stocks fare best. As one can see, the tech sector tends to rise by an average of 20% in the 12 months following the first interest rate hike. It outperforms the broader stock market nearly 70% of the time, too.
Recap on the reasons for these developments in the past: Technology companies help others improve productivity. So as interest rates rise, and the economy cools, America spends more on technology so that companies can do more with less. In turn, technology firms benefit from the boost in sales.
As mentioned in the phrases above, technology companies typically don’t borrow much money. So as rates rise, there’s less risk of interest charges significantly cutting into their margins. Contrast that with utility companies, for example, which rely heavily on debt (above I already mentioned another sector: Industrials).
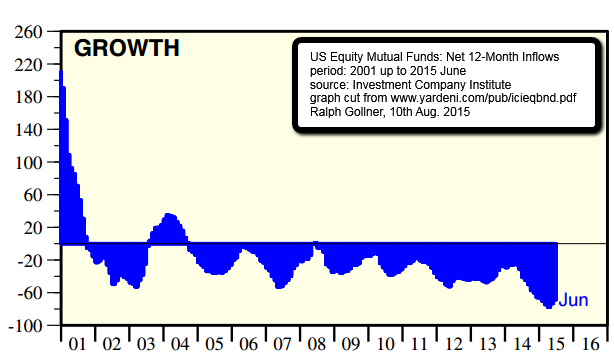
From a sentiment-point-of-view
one can see in the lower chart that the frenzy of the year 2000 .com-Bubble is far away and still not all forgotten. The pace in net outflows in Growth-US equity mutual funds accelerated up to June 2015.
If one wants to think contrarian one may observe the monthly net-inflows in the Growth-space of the assets-universe: