Related Categories
Related Articles
Articles
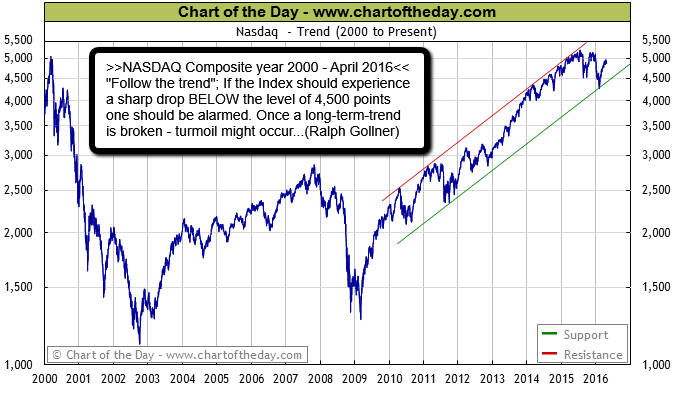
NASDAQ Composite (2000 - April 2016)
Since the year 2000, the Nasdaq Comp. has traded in a very volatile fashion with two major bear markets (the dot-com bust and the financial crisis) along with two major bull markets (the credit bubble rally and post-financial crisis rally).
 Text/link: see also http://www.dogsofthedow.com
While the financial crisis induced bear market of late 2007 to early 2009 was severe (the Nasdaq declined 56%), the bull market that followed has been impressive with a gain of 311% - resulting in new record highs. As the chart above illustrates, the Nasdaq traded within the confines of an upward sloping trend channel beginning in 2010 (see green and red trendlines).
It is noteworthy that the Nasdaq has been able to hold trend into 2016 despite many significant geopolitical and economic headwinds (e.g. Middle East wars, a plunge in oil prices, difficulties in China and Europe, etc.). More recently, sluggish performance in 2015 into 2016 (partly due to a weakening Chinese economy) has resulted in a retest of support (see green line).
Note: For highly regarded charts that focus on where the market is headed with valuable indicators that you won't find anywhere else, I highly recommend that you sign up at Chart of the Day: http://www.chartoftheday.com
Current state of momentum, see the DAILY! - updated chart of the NASDAQ-COMPOSITE (weekly close):


