Related Categories
Related Articles
Articles
Food/Restaurants(Index) versus Oil(-&Gas Index)
Following a chart of the Dow Jones U.S. Food & Beverage Index (DJUSFB) versus the Oil(& Gas)-Index (XOI). One can see the negative correlation which evolved since Q4-2014.
daily updated chart DJUSFB versus XOI:
This development follows research done in Feb. 2015 regarding the positive implications for the money-pockets of the US-American consumer by grassroots reasearch / published via Allianz Global Investors: http://www.allianzgi.com
In the survey mentioned US consumers were asked to name the top two categories where they anticipate spending savings from lower-than-normal petrol prices. Kelly Reuba (Global Head of GrassrootsSM Research) is explaining in the article, that according to the US Energy Information Administration, the average household is expected to spend USD 710 less for petrol in 2015 compared with 2014 – nearly USD 60 in monthly savings – because of lower retail prices.
In the survey done in February 2015 a total of 1,000 US consumers were asked to assess how much money they believe they are saving, and what they are doing with this extra disposable income. Respondents were required to drive their own vehicle three or more times per week.
Food/Restaurants and Debt Were Top Uses for Extra Money
The top two categories where consumersanticipate spending savings from lower-than-normal petrol prices: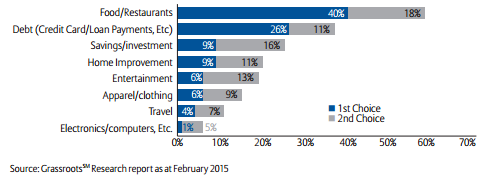
Among the 88 per cent of respondents who observed a decrease in petrol prices in the past six months (status as per Q1-2015), 65 per cent perceive the savings to be anywhere from USD 5 to USD 49 per week (about USD 20 to nearly USD 200 per month).
Among respondents who cited a decrease in petrol prices, 86 per cent will likely spend at least some of the money they are saving, including 16 per cent who will likely spend all of the money.


