Related Categories
Related Articles
Articles
BOFA Fund Manager Survey (Jan/Feb. 2016)
Fund Managers' Current Asset Allocation
Among the various ways of measuring investor sentiment, the BAML survey of global fund managers is one of the better as the results reflect how managers are allocated in various asset classes.
The managers covered by the Survey oversee a combined 600bn USD in assets. The data should be viewed mostly from a contrarian perspective; that is, when equities fall in price, allocations to cash go higher and allocations to equities go lower as investors become bearish, setting up a buy signal. When prices rise, the opposite occurs, setting up a sell signal.
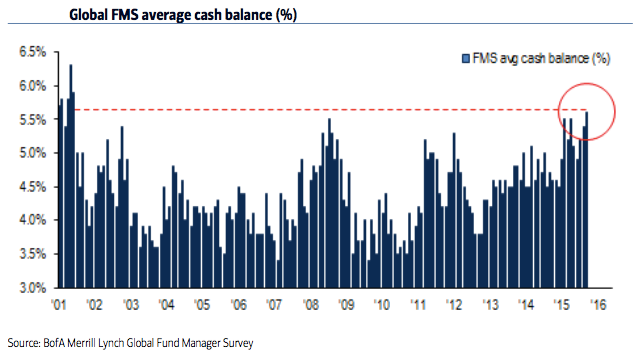
As can be seen in the chart above/Cash: Fund managers cash levels jumped to 5.6%, the highest since the post-9/11 panic in November 2001, and lower than at any time during the 2008-09 bear market. This is extraordinary. Current levels (Jan. 2016) are an extreme that is normally very bullish for equities.
! Even November 2001, which wasn't a bear market low, saw equities rise nearly 10% in the following 2 months!
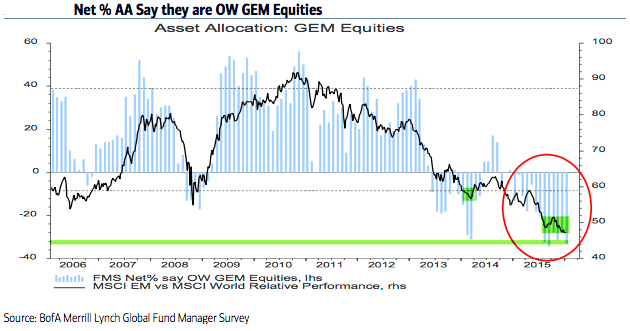
Emerging markets equities: Emerging markets were the only region to see an increase in exposure this month (to -23% underweight). In January, allocations had fallen to the second lowest in the survey's history, an extreme comparable only to early 2014 from which the region began to strongly outperform for the next half a year. Emerging markets have recently started to outperform again. There should be more upside, as allocations remain 1.8 standard deviations below the long term mean (please check following chart):
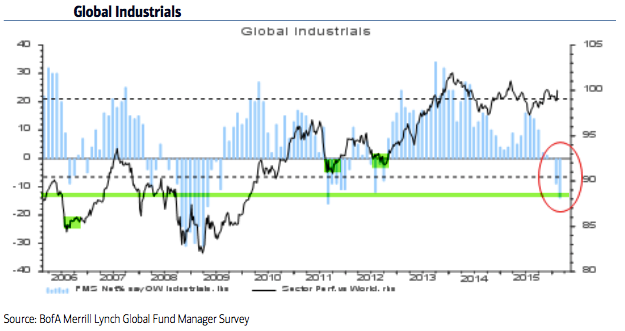
Fund managers' allocation to industrials fell to the lowest level since August-2011 (1.6 standard deviations below the mean). From a contrarian perspective, the sector may be set up to outperform:
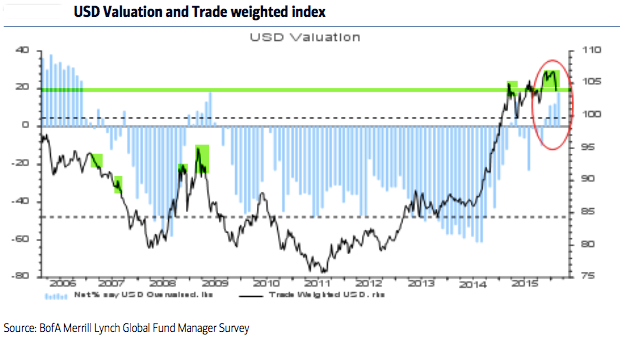
US Dollar: Since 2006, fund managers surveyed by BAML have been very good at determining when the dollar is overvalued. In March 2015, they viewed it as overvalued for the first since 2009; the dollar index fell from 100 to 93 in the next two months. They again view the dollar as overvalued (the highest since November 2006) and the index has recently turned lower. Similar cases are highlighted in green. The dollar is considered to be the most overvalued in the past 9 years. Under similar conditions, the dollar has fallen in value:
sources:
http://www.zerohedge.com
http://fat-pitch.blogspot.co.at


