Related Categories
Related Articles
Articles
S&P 500 Price-Book-Value (July 2016)
Some investors put more "faith" in the Price/Book Value ratio than the P/E ratio when assessing the valuation of stocks or the stock market as a whole. As a result, Forbes conducted a historical review of Bloomberg data for the S&P 500.
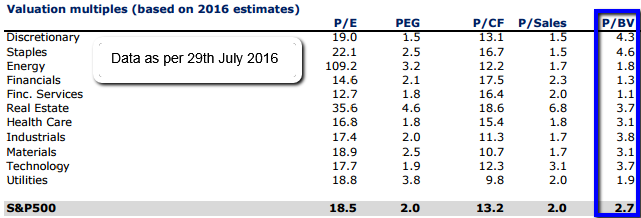
The average Price/Book Value ratio of the S&P 500 for the period December 1990 - August 2015 was ca. 2.87 (according to the mentioned Forbes-article). In comparison, the Price/Book Value ratio of the S&P 500 as of 28th/29th July 2016 was 2.7 at a S&P 500 level of ca. 2,160 - 2,170 points (history-quote taken from finance.yahoo.com).
It should be noted, all "current" valuation metrics were calculated based on consensus estimates of current index constituents, as collected by Bloomberg and FactSet. I still feel comfortable, that the PB/V of 2.7 is < 2.87 :-)
But one should also keep in mind, that there may never be two different sources giving the same exact valuation results (due to timing of calculation, data-interpretation, etc.). Following you will find a historic P/BV-ratio-series of the past (source was multpl.com):
2007: 2.77
2006: 2.81
2005: 2.76
2004: 2.92
2003: 3.03
2002: 2.73
I excluded the valuation ratios in some years before, because (to my point of view), the valuation-ratios in the years 1999 and 2000 made "no sense"...(irrational exuberance). BUT/Just for your info: According to Standard & Poor's Research Insight the PB-ratio of the S&P 500 in the year 2000 was 5.6!
Valuation-sheet July 2016/.pdf (S&P 500 and Sectors, Bloomberg, Factset): http://www.sectorspdr.com
Other Research-Papers on Valuation and S&P500-Sectors: http://www.sectorspdr.com/sectorspdr/sectors


