Related Categories
Related Articles
Articles
AAII Bullish Investor Sentiment (01/2005 - 01/2016)
Each week, AAII asks its members a simple question: Do they feel the direction of the stock market over the next six months will be up (bullish), no change (neutral) or down (bearish)? Here the most recent reading:
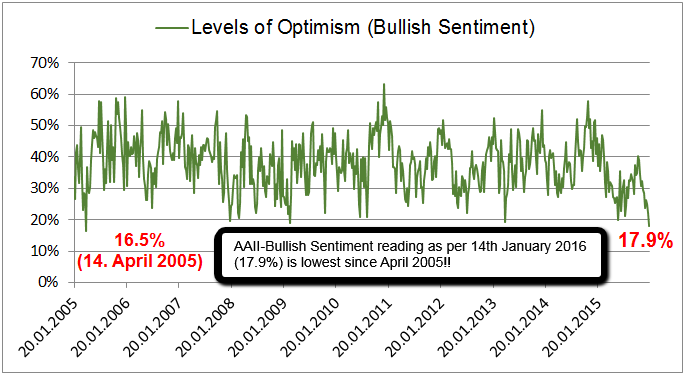
In the graph above I put up the weekly bullish-sentiment-readings from 2005 up to 14th January 2016. Both the dates (April 2015 & 14th Jan. 2016) have one thing in common: a reading BELOW 18.5%!. Extraordinarily low levels of optimism have worked best as a contrarian signal for potential Long-positions in the broad US-Market. Bullish sentiment has been below two standard deviations of its historical mean 16 times during the survey’s history (from 1987 onwards). The average and median six-month gains for the S&P 500 following these low readings were 14.0% and 17.7%, respectively. The average and median 12-month gains were 20.7% and 21.7%, respectively. The S&P 500 large-cap index rose every time after the AAII-survey indicated an extraordinarily low level of optimism.
Performance of Sentiment Survey as a Contrarian Indicator** (relevant as per 14th January 2016-reading):
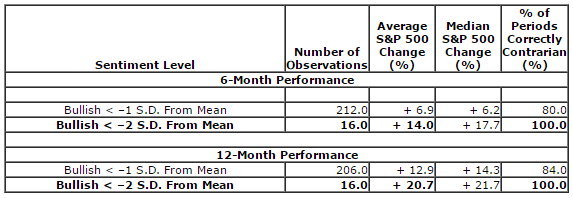
**Based on data from July 24, 1987, to May 2, 2013. Numbers are rounded
As per 14th January 2016 the Bullish Sentiment Reading lies 2 Standard Deviations BELOW the Mean!
>> The S&P 500 marked an Intraday-Low of ca. 1,878 points and a closing-level of ca. 1,929 points on that day.
theoretic subsequent 6-Month Performance (14th July 2016, S&P 500):
Following the statistics above a rise of 14% would lead to a minimum level of 2,140 points on 14th July 2016 (1,878 x 1.14).
theoretic subsequent 12-Month Performance (16th January 2017, S&P 500):
12 months from now, applying the statistics above the S&P 500 could be @ ca. 2,266 points (14th Jan. 2017; 1,878 x 1.207).
A possible path within the next months, implying a turnaround to reach the first potential target in July 2016 would result in following picture: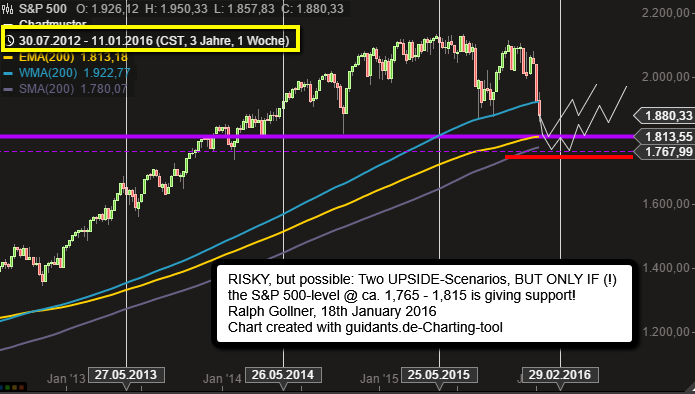
source for calculations: http://www.aaii.com


