Related Categories
Related Articles
Articles
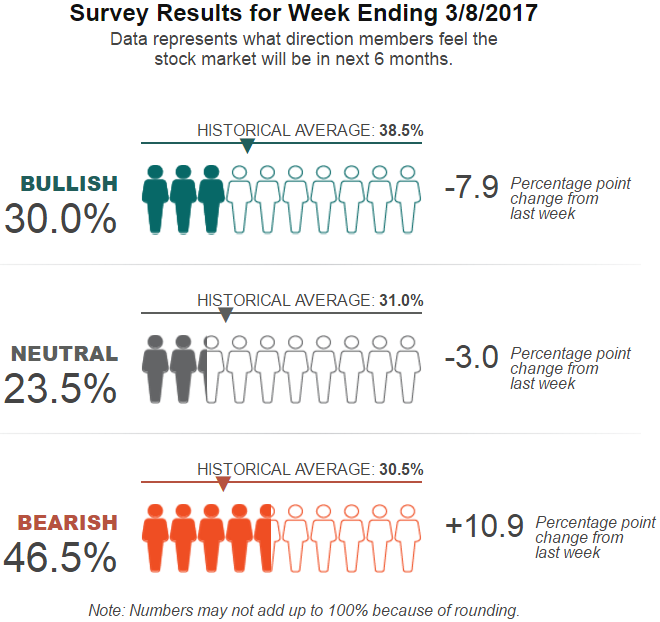
Weekly AAII Sentiment Survey (8/9th March 2017): Pessimism surged to its highest level since February 2016. Past occurrences of unusually high levels of bearish sentiment have a mixed record of being followed by bigger-than-average six-month gains in the S&P 500.
Pessimism among individual investors jumped to its highest level in more than year in the latest AAII Sentiment Survey. At the same time, the percentages of individual investors describing their six-month outlooks as "bullish" or "neutral" fell.
Bullish sentiment, expectations that stock prices will rise over the next six months, plunged 7.9 percentage points to 30.0%. Optimism was last lower on 2nd November 2016 (23.6%). The drop keeps bullish sentiment below its historical average of 38.5% for the seventh time in eight weeks.
Neutral sentiment, expectations that stock prices will stay essentially unchanged over the next six months, fell 3.0 percentage points to 23.5%. This is a three-month low. It is also the third consecutive week with neutral sentiment below its historical average of 31.0%.
Bearish sentiment, expectations that stock prices will fall over the next six months, jumped 10.9 percentage points to 46.5%. Pessimism was last higher on February 10, 2016 (48.7%). The increase keeps bearish sentiment above its historical average of 30.5% for a fourth consecutive week and the seventh time in eight weeks.
Bearish sentiment is above its typical range. Historically, the S&P 500's performance following unusually high levels of pessimism has been mixed, with a median six-month gain of 5.8% versus 4.9% for all six month periods between July 1987 and November 2016. The likelihood of the S&P 500 index being higher in six months is lower, however, 67.8% versus 73.1%.
Bullish and neutral sentiment both remain within their typical historical ranges even with this week's declines.
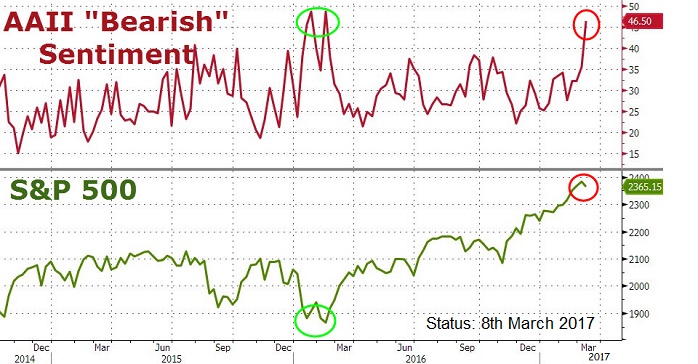
Pessimism has largely been above average since mid-January 2017, as noted above. This week's big jump has occurred as both large-cap and small-cap stocks have pulled back from their recent highs. Many individual investors are concerned about stocks having rallied too far, too fast or high valuations. At the same time, the potential impact that President Trump could have on the domestic and global economy continues to cause uncertainty or concern among some investors, while encouraging others. It's also possible that the recent increase in expectations for a rate hike at next week's Federal Reserve meeting could have dampened some individual investors' moods, even though many have been frustrated by the ongoing low interest rate environment.
This week's special question asked AAII members to share their thoughts about the current duration of the bull market, which has marked its eighth birthday on Thursday, 9th March 2017. More than half of all respondents (57%) believe the market is at risk of falling. Several of these respondents are anticipating a correction (a drop of at least 10%). Others cited politics or valuations. Conversely, nearly 18% of respondents think the bull can continue to run. Several of these respondents cited optimism about the Trump administration as the reason, while others think stock prices will continue to rise as long as earnings do.
Historical Recap
Two examples stand out when considering extremes as measured by the AAII survey. On 6th January 2000, the AAII bullish percent set an all‐time high of 75.00%. The S&P 500 that day was 1,403.45. By 12th March 2003, the S&P 500 had fallen 43.79% to 788.90.
In the four weeks prior to the March 2003 low, the AAII bullish percent ranged from 21.90% to 34.30%. From the March 2003 market low and the low bullish percent reading, the S&P rallied for a 47.45% gain by March 2004.
And then there is the reverse...
On 5th March 2009 the AAII bearish percent reached its highest level ever at 70.27%. One day later, the S&P 500 hit its intraday low at 666.79 before embarking on a rally that by 29th April 2011 sent the S&P 500 105% higher to 1,370.58...
source for the historical recap:
www.janney.com/File_January-23--2017.pdf
You may also want to look at an interesting article discussing the possible "Contrarian-idea" behind the AAII-Sentiment-reading/indicator (article from the year 2004, the AAII-Sentiment Indicator was introduced in the year 1987 already!):
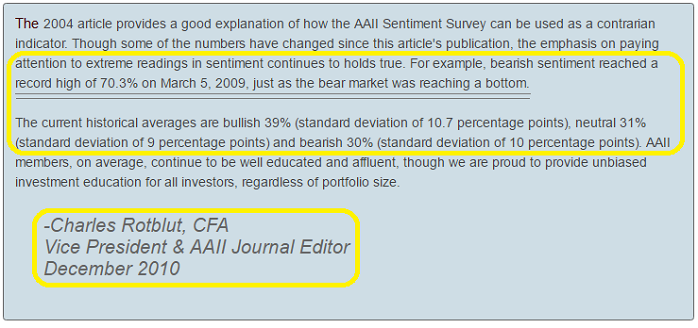
link for the 2004-article (Research/.pdf on "Contrarian & AAII-sentiment") www.aaii.com/files/sentiment
other link: www.zerohedge.com/news


