Related Categories
Related Articles
Articles
AAII Investor Sentiment (Bulls: LT-LOW)
The percentage of individual investors optimistic about short-term gains occurring in the stock market is at its lowest level in 11 years (17.8%). This is the lowest level of optimism recorded by that survey since 14th April 2005 (16.5%).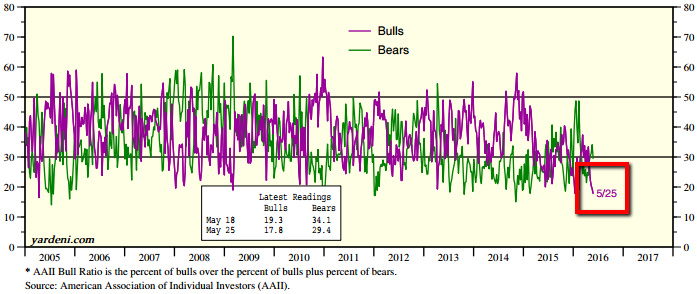
At the same time, the percentage of investors describing their outlook as neutral is at its highest level in 16 years, according to the latest AAII Sentiment Survey.
Bullish sentiment, expectations that stock prices will rise over the next six months, declined 1.6 percentage points to 17.8%. It is the 29th consecutive week and the 62nd out of the past 64 weeks that bullish sentiment has been below its historical average of 39.0%!
Neutral sentiment, expectations that stock prices will stay essentially unchanged over the next six months, jumped 6.3 percentage points to 52.9%. Neutral sentiment was last higher on 12th April 12 1990 (56.0%)! Neutral sentiment has now been above 40% for 12 consecutive weeks and above its historical average of 31% for 17 consecutive weeks, as well as for 69 out of the past 73 weeks.
Bearish sentiment, expectations that stock prices will fall over the next six months, fell 4.7 percentage points to 29.4%. The historical average is 30%.
Since the AAII Sentiment Survey started in June 1987, a neutral sentiment reading above 50% has only been recorded 28 times. Only six of those readings were recorded after 1989 (January 1991, July 1991, August 1994, February 2003, December 2015 and this week). The remaining 22 readings are all from the approximate two-year span of December 1987 through October 1989. On average, the S&P 500’s 26- and 52-week returns following such occurrences were 8.4% and 20.5%, respectively.
Even rarer is having bullish sentiment below 20% and neutral sentiment above 50% on the same week. This week is just the sixth time such a combination has happened. It previously occurred four times in 1988 and once in 1989. On average, the S&P 500’s 26- and 52-week returns following those five occurrences were 11.2% and 25.7%, respectively.
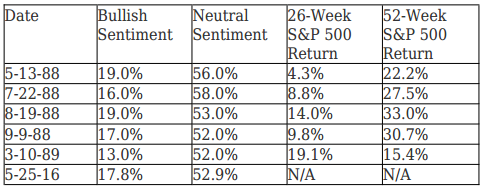
The table above shows these occurrences and how the S&P 500 fared following each of them. Pay attention to the dates; the previous five readings are all from a 10-month span between May 1988 and March 1989. There is no guarantee that the returns for this short period of time are indicative of future market performance.
If history serves as a guideline for the next 6 to 12 months, following S&P 500 index levels could be reached. Current S&P 500 level as per 25th May 2016 (2,090 points):
♦ 2,090 points x 1.043 = 2,179 (as per 25th Nov. 2016)
♦ 2,090 points x 1.154 = 2,411 (as per 24th May 2017, my 39th birthday ;-)
link-AAII survey & yardeni-pdf.:


