Related Categories
Related Articles
Articles
Investor Movement Index (IMX)
The Investor Movement Index, or the IMX, is a proprietary, behavior-based index created by TD Ameritrade designed to indicate the sentiment of retail investors. The IMX saw its largest ever single month increase in August as volatility hit a two-year low!
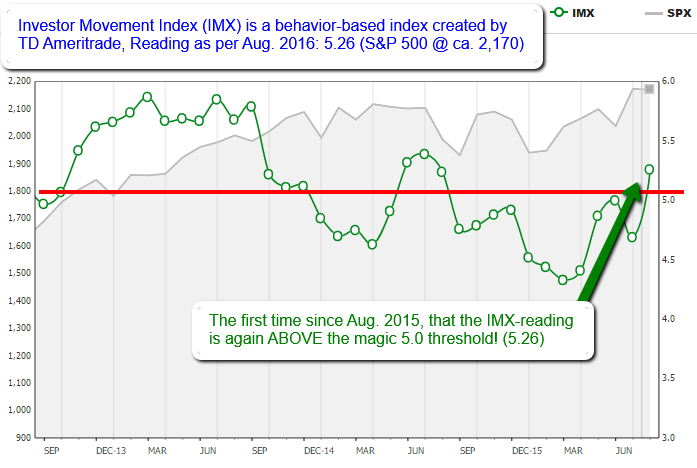
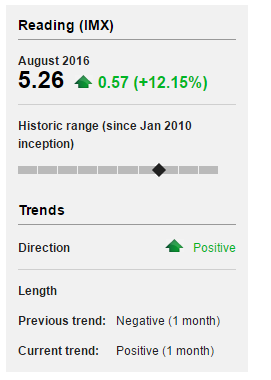
TD Ameritrade clients seemed to position their accounts for more exposure in August, as the volatility of the S&P 500 reached its lowest point since 2014. The lower overall volatility had the effect of increasing the relative volatility of many widely held positions, including Apple Inc. (AAPL) and Facebook Inc. (FB). This increased relative volatility drove the IMX up 0.57 to 5.26, its highest level since July 2015.
 The major equity market indices saw mixed results during August IMX period, with the NASDAQ gaining 1.48% and the Russell 2000 adding 1.1%. The S&P 500 and Dow Jones Industrial Average were essentially flat, with both declining about two-tenths of a percent. Crude oil prices increased in August, following a decline in July, and briefly touched $49 a barrel before declining to end the month. Treasury yields remained largely unchanged during the month. Although there was no Federal Reserve board meeting in August, markets seemed to be waiting for some news from Reserve Chair Janet Yellen, who spoke near the end of the month. The overall message from the Reserve Chair seemed to be that an improving labor market and a strengthening economy might warrant another increase to the Fed's key interest rate.
Final wrap-up/explanation on IMX:
If a score increases month over month, that likely means that investors are getting more bullish. If a score decreases month over month, investors are becoming bearish (or at least less bullish than before).


