Related Categories
Related Articles
Articles
Cash Indicator and other great stuff from BofAML
(Jan./Feb. 2017)
The BofAML Fund Manager Survey (FMS) is a monthly survey of 200-250 primarily long-only investors. One of the key questions in this survey asks for cash balance as % of assets under management. A low cash balance indicates...
...investors are vulnerable to negative market shocks, while a high cash balance means investors could be underinvested & vulnerable to positive market shocks.
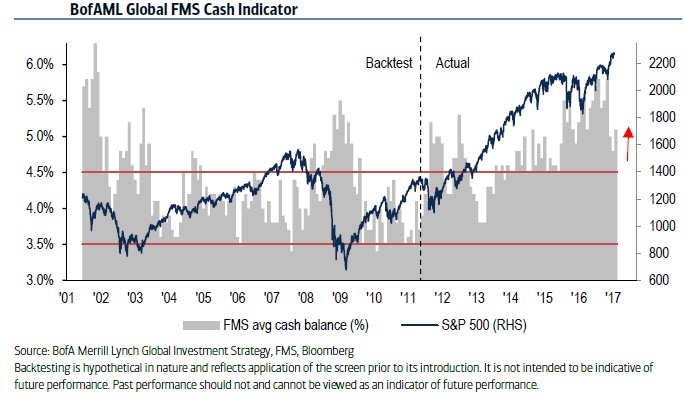
BofAML Global FMS Cash Rule - Bullish
(The rule)
♦ Buy equities when the FMS average cash balance rises to 4.5% or higher
♦ Sell equities when the FMS average cash balance falls to 3.5% or lower
Cash inched higher to 5.1% in Jan. 2017 from 4.8% last month. Current reading remains elevated vs its 15-year history and overall FMS does not yet show “peak greed”. Rule stays in "buy" territory.
A critical look at the Global FMS Cash Rule
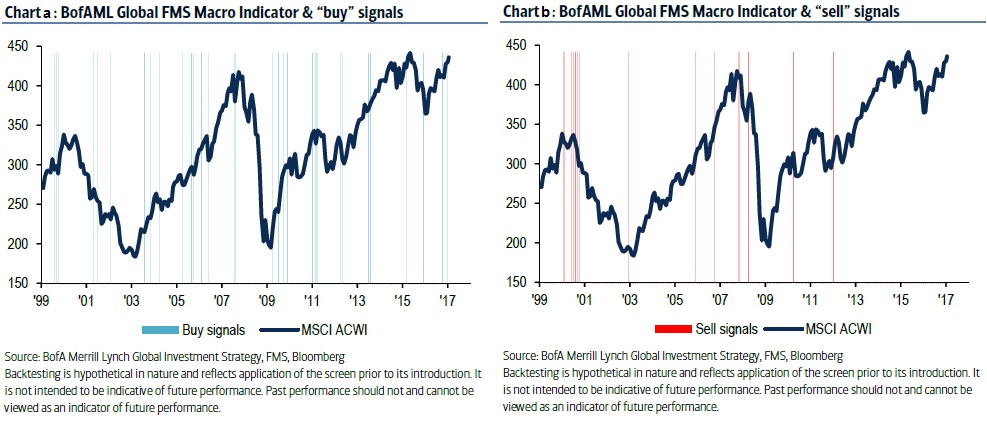
The Global FMS Cash Rule has been a reliable barometer of risk appetite since we first introduced it back in 2011. After a contrarian "buy" signal is triggered, the median return for US equities is 1.0% over the next month, 1.4% over the next two months and 2.9% over the next three months. Likewise, after a contrarian "sell" signal is triggered, the median loss for US equities is -0.5% over next three weeks, -3.5% over next four weeks and -2.6% over next five weeks. In short, the simple "buy" (>4.5%) and "sell" (<3.5%) thresholds has provided good tactical recommendations over the years.
Status from May 2013 - Jan. 2017: But cash levels have remained elevated ever since the May 2013 "taper tantrum" with cash rarely dipping below 4.5%. As a result, the rule has been in persistent "buy" territory since Nov. 2013, behaving less like a tactical indicator and more like a cyclical indicator over the past three years.
Over the past few months, BofAML has asked survey participants for reasons why they are holding consistently higher levels of cash in recent quarters.
♦ On average, 53% simply cited their "bearish views on markets"
♦ 47% listed either structural factors (regulatory/industry changes, higher derivatives costs & margin requirements) or preference for cash over low-yielding equivalents
BIG QUESTION: "Is it time to sell the market?"
According to Bank of America, the answer, at least for now, is no. That's the conclusion of BofA's chief investment strategist Michael Hartnett who looks at the bank's 7 favorite, proprietary market-timing indicators, and finds that, at least based on historical patterns, the major selling is not imminent, adding that "we remain bullish risk assets; "3P’s", Positioning, Profits & Policy, drive our tactical & cyclical views; our latest Rules & Tools piece shows Positioning has become more bullish but not yet dangerously euphoric." He finds that according to his market-timing indicators, the next step is the opposite, and the current rally will end "with one last 10% melt-up in stocks & commodities in 2017."
Here is how Hartnett lays out his "rules" to quantify market fear and greed:
"Our rules can help identify major inflection points in market cycles. We track a broad array of positioning, sentiment, and flow data that signal when global equities are likely to peak or trough. For example, our Global Breadth Rule measures oversold conditions across global markets, and our Bull & Bear Indicator tracks 18 different indicators of flows and positioning."
Harnett follows 7 rules and indicators (more details on 3 rules are stated in this posting):
♦ BofAML Bull & Bear Indicator is our broadest measure of investor sentiment; readings range from 0-10; currently at 6.1; indicator still shy of "sell" trigger of 8.0.
♦ Global FMS Cash Rule measures institutional cash levels as gauge of fear & greed; As mentionend currently at 5.1% (above "buy" threshold of 4.5%), i.e. indicator in "buy" territory.
♦ Global FMS Macro Indicator augments our existing Cash Rule with a filter for macro momentum; currently in "buy" territory as macro momentum trending higher past 6 months & cash levels higher past 2 months.
Digging deeper -again- BofAML Global FMS Macro Indicator - Bullish
(The rule)
Buy global equities when Global FMS Macro is improving and cash level is rising relative to past two months Sell global equities when Global FMS Macro is deteriorating and cash level has fallen by at least 50bp relative to past two months What is it?
The FMS Macro Indicator is a year-on-year measure that comprises five components: investor inflation expectations, capex demand, risk appetite, cyclicals vs defensive^ sector positioning and equity vs bond positioning. ^ cyclicals = industrials, materials & tech; defensive = staples, telcos & utilities
Latest signal:
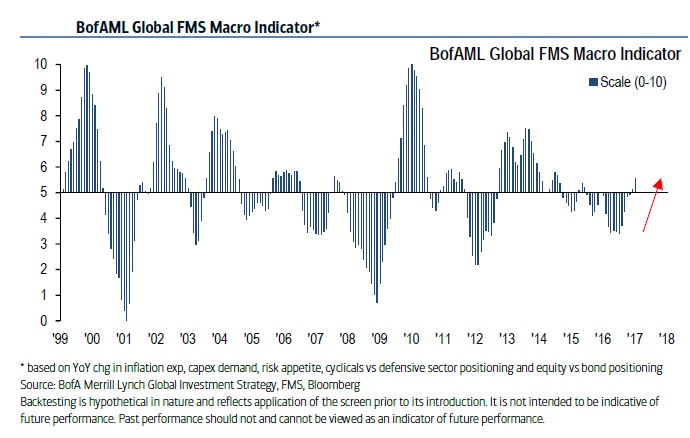
The Global FMS Macro Indicator augments the Cash Rule with a filter for macro momentum. It is currently in "buy" territory as FMS Macro has been trending higher for the past 6 months and January 2017 cash level is higher than it was two months ago. This is a bullish combo for risk assets because investors have been reluctant to deploy cash even though FMS Macro is positive and clearly on the upswing (see Chart above).
History (buy versus sell-signals):
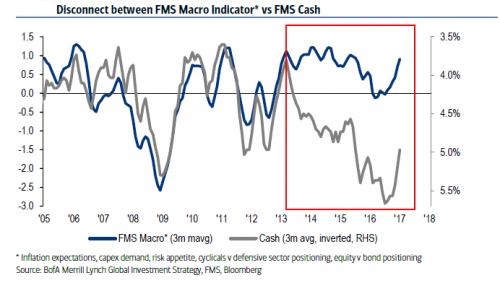
BOFAML believes that the May’13 "taper tantrum" has awakened investors to the risk that the central bank-induced "long duration/yield" trade is vulnerable to violent unwinds from either a "bond shock" and/or faster-than-expected policy normalization. As a result, investors are holding higher-than-normal cash as an insurance policy even though their inflation expectations are high, capex demand is strong and positioning in cyclical vs defensive sectors is rapidly improving (see following chart):
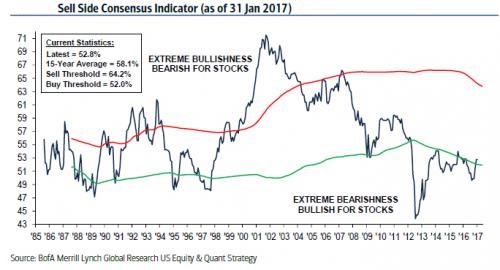
Sell Side Indicator - Neutral
The rule
♦ Bullish signal: when Wall St is bearish…Sell Side Indicator >1? below the mean
♦ Bearish signal: when Wall St is bullish…Sell Side Indicator >1? above the mean
♦ Index target: the indicator can be used to predict +12-month S&P 500 total returns and is one of five input models used by our US Strategy team for their S&P 500 target
What is it?
BofAMLs' US Equity & Quant Strategist Savita Subramanian's Sell Side Indicator is based on a survey of Wall Street Strategists that submit asset allocation recommendations to us and/or Bloomberg. The indicator shows the average recommended equity weighting in a balanced fund. A contrarian Buy (Sell) signal is triggered when the indicator is more than 1 standard deviation below (above) its mean on a rolling 15-year basis.
Latest signal… equity sentiment was unchanged in January 2017
In January, the Sell Side Indicator is unchanged at 52.8, staying in "Neutral" territory for a second consecutive month. This follows the biggest two-month increase in optimism since 2013. While sentiment has improved significantly off of the 2012 bottom - when this indicator reached an all-time low of 43.9 — today's sentiment levels are still below last summer's high of 54.0 and where they were at the market lows of March 2009. The recent inflection from skepticism to optimism could be the first step toward the market euphoria that we typically see at the end of bull markets and that has been glaringly absent so far in the cycle.
links:


