Related Categories
Related Articles
Articles
Consumer Sentiment vs. S&P 500
I created a chart comparing the Michigan Consumer Sentiment versus the U.S. Stock market (S&P 500) since the last recession (2008/2009). For the moment (Q1-2017) it seems that the famous "Animal spirits" have taken over...
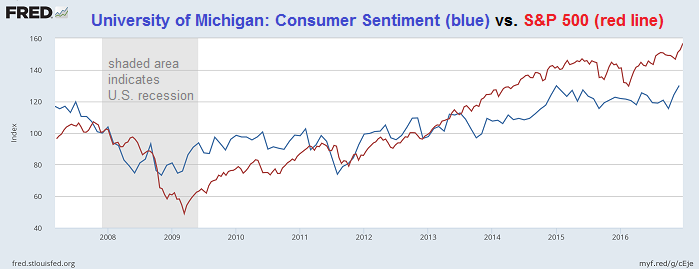
The final reading of the University of Michigan's consumer sentiment for the United States rose to 98.5 in January 2017 compared to a preliminary figure of 98.1 and 98.2 in December 2016. It is the highest reading since January of 2004, due to a more optimistic outlook for the economy and job growth during the year ahead as well as more favorable economic prospects over the next five years. Consumer Confidence in the United States averaged 85.99 from 1952 until 2017, reaching an all time high of 111.40 in January 2000 and a record low of 51.70 in May 1980.
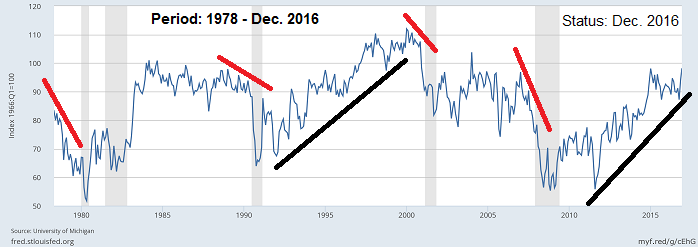
I was born in the year 1978; Since that year the U.S.A. experienced several recession periods. Most of these were accompanied by falling consumer sentiment readings - before, shortly before and (obviously) during that periods. For the moment, consumer sentiment is holding up steady:
Please also recheck the monthly surveys under following link:
www.tradingeconomics.com/united-states


