Related Categories
Related Articles
Articles
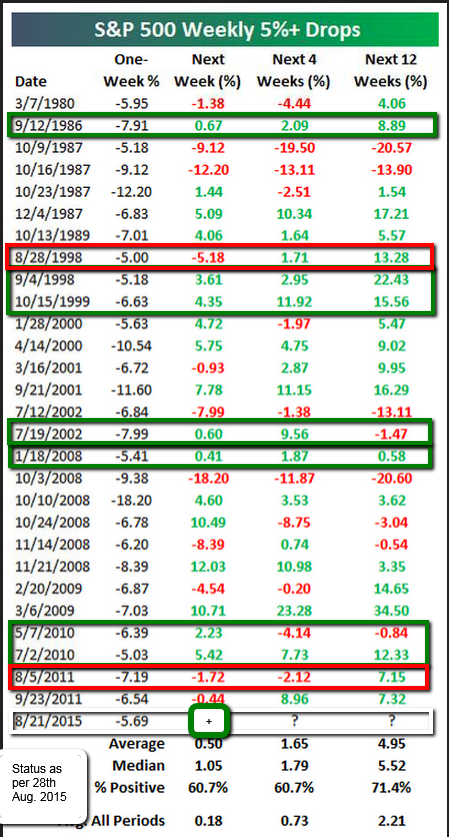
Below a historical breakdown of the 5% weekly drops and the subsequent performance in the S&P 500
From a starting point in the S&P 500 of the opening of 1,965 points as per Monday, 24th Aug. 2015, this leaves me with my best guess that the S&P 500 may end the year 2015 well above 1,925 points, in my view at least above 1,940 points (this guess is the only thing how I can employ a strategy heading into Sep. 2015 and Q4/2015).
This guess of course leaves a POTENTIAL DOWNSIDE from the Status Quo (S&P 500 @ 1,988 points per Friday, 29th Aug. 2015, market close) of 2,43% => ONLY if one thinks that the level of 1,940 may be the worst case for Year-End 2015.
In my view this gives me a good Chance/Risk-Relation well into January 2016 => As the 2,43% downward possibility has to be read in face of a potential upmove (> 7%) back to the All-Time-High in the SPX (being @ ca. 2,134 points).
If, however, the Index will fall & then stay below 1,910 or even 1,886 again - it may be time to take a break from the markets...
Personal view - given by Ralph Gollner (29th Aug. 2015)
historical data/source: http://www.bloomberg.com


