Related Categories
Related Articles
Articles
Correlation between the S&P 500 and high-yield bonds
Evolution and interesting performance curves over the last 12 months in the SPX (S&P 500) versus HYG ($ High Yield Corporate Bond ETF; components fo the HYG: https://www.ishares.com):
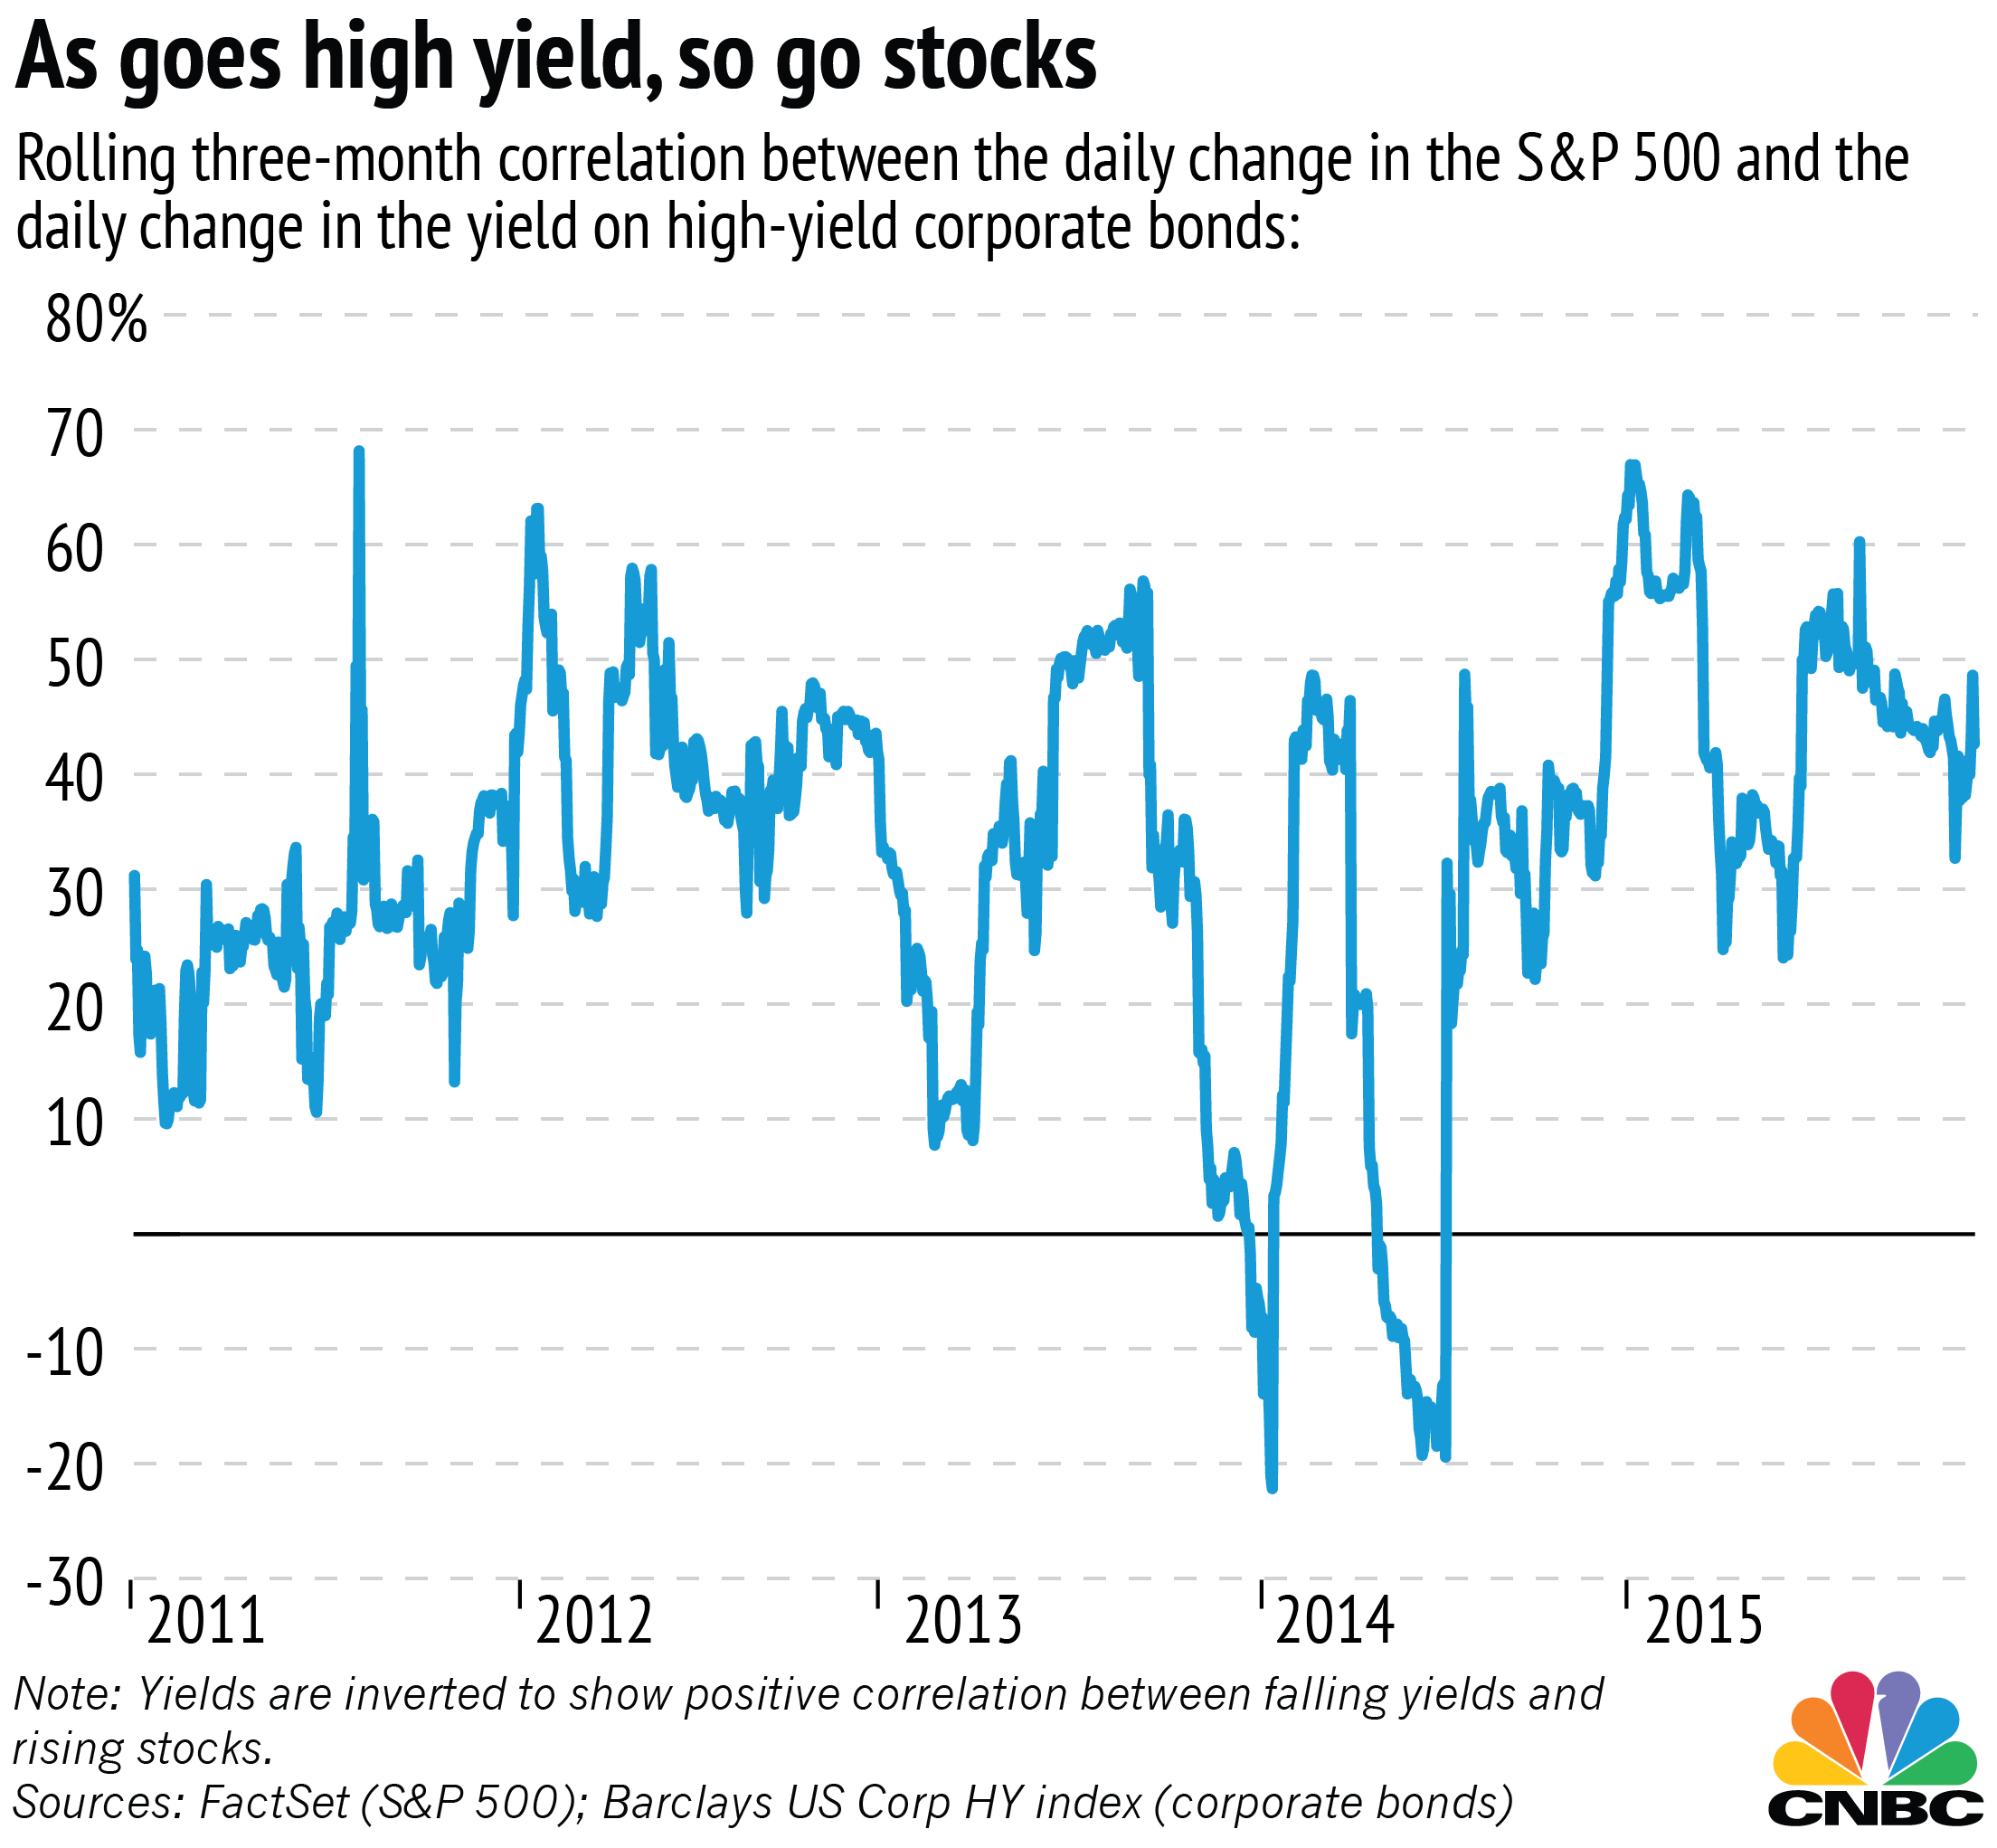
To be specific, following a chart of the rolling three-month correlation between the S&P 500 and the Barclays U.S. Corporate High Yield Bond Index.
As you can see in the graph, over the past five years, the correlation has almost always been positive. Even though they are still technically "bonds," junk bonds reflect a higher-risk portion of the spectrum, and hence trade more similarly to stocks.
The average correlation over this entire time period is around 35 percent. But we've seen it swing widely, from a high of 68 percent to a low of negative 22 percent. Right now, we are experiencing correlations in the 40s — so just slightly higher than usual.
For now, the high-yield problems haven't come to affect broader equities in a meaningful way...(Article/comment by cnbc on 15th Dec. 2015).
original article/comment: http://www.cnbc.com


