Related Categories
Related Articles
Articles
Valuation S&P 500
(Price/Sales-Ratio @ ca. 2,000 points, Year 2014)
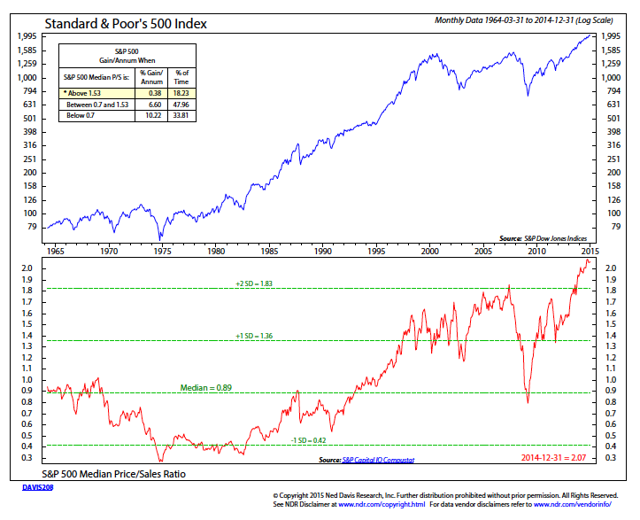
In following chart the PS-Ratio of the S&P 500 as per June 2014 is displayed. Under this source the S&P 500 carried a PS-Ratio of 1.75 @ an Index-level of ca. 1,960 points that time.
 source: http://www.am-a.com
Interesting to know, that the current Index-level as per 11th Dec. 2015 is ca. 2,010 points (therefore slightly above its level ca. 18 months before).
Info on the PS-ratio-indicator: The S&P 500’s Price/Sales ratio - a measure of the stock market’s capitalisation relative to its sales over the past year - can tell us about what stock market returns might be over the next few years. In this case, we seem to be have been AND still are on the upper-end of the valuation-band (a PS-Ratio of 1.75 or above implies a subsequent annualized 3-Year Return of MAXIMUM 5%-7% year over year, but often also NEGATIVE return-outcomes year-over-year).
While there is no way to know whether this relationship will hold in the future, Arthur Coyne, Senior Research Analyst with Arnerich Massena, noted that as of June 30, 2014, the S&P 500’s Price/Sales ratio of 1.75 was clearly above the historical average. Taken in isolation -as mentioned - this single indicator implied a relatively low S&P 500 return for the next three years, all things being equal. Now, it can be said, that over HALF OF THAT FORECASTING Period (18months/36total) the TOTAL-return in the S&P 500 was merely + 2.5% over the 18 months-timeframe so far.