Related Categories
Related Articles
Articles
S&P 500
100-point gain(s)
S&P 500's 100-point climb to above 2,600 is fastest move since 1998! In the abbreviated session of Black Friday, the S&P 500 index marked its fastest rise to a 100-point milestone - closing at an all-time high at 2,602.42 - since 1998,...
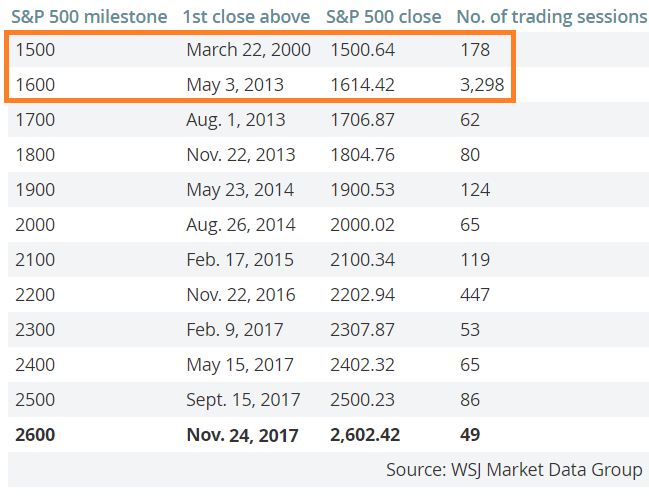
...according to WSJ Market Data Group. (As the index climbs, each 100-point gain represents a smaller percentage move.)
According to Bloomberg News, average analysts' estimates call for the S&P 500 to hit 2,800 by the end of 2018. Brian Belski at BMO Capital Markets is the most bullish among those surveyed with his call for a rise to 2,950 next year (2017), supported by strong corporate earnings.
Savita Subramanian, market strategist at Bank of America Merrill Lynch, began in the year 2017 with a prediction for a 20% gain for U.S. stocks; This would have placed the Dow at 24,000, the S&P 500 at 2,700 [...]. She wasn't that far off the mark.
In the following table, one can see, just how few days lay between each of the 100point-steps between March 1995 and March 2000:
S&P 500 DATE Days between each 100points-step
points
500 March 24, 1995
600 Nov. 17, 1995 166
700 Oct. 4, 1996 222
800 Feb. 12, 1997 90
900 July 2, 1997 97
1,000 Feb. 2, 1998 147
1,100 March 24, 1998 35
1,200 Dec. 21, 1998 189
1,300 March 15, 1999 56
1,400 July 9, 1999 81
1,500 March 22, 2000 178
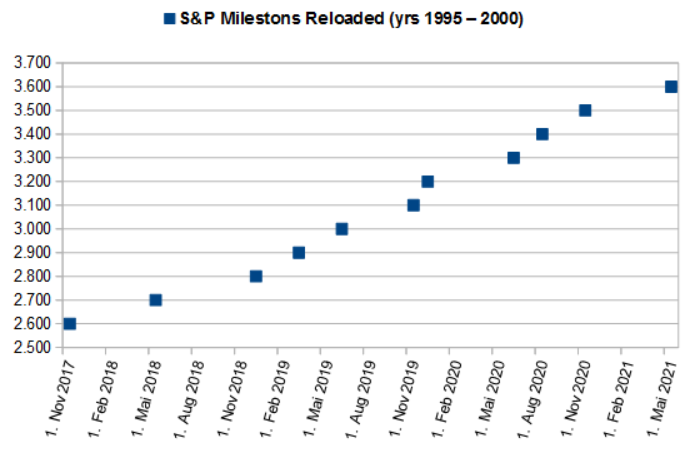
I made a funny computation for the future period from Nov. 2017 onwards until May 2021 by copying the same 100-point-time-intervalls from 2,600 points up to 3,600 points. Funny way (ahead), what do you think? >> Remark: But don't take this too serious, but be amazed about the freaky rising stock market in the late 90s (recheck table above !!):