Related Categories
Related Articles
Articles
Buyback yield + Dividend yield
Recheck the total amount that companies are returning to shareholders - a total that includes both dividends and share repurchases (or buybacks). Up until several decades ago, dividends were the predominant way in which companies returned cash to...
...shareholders, so up until then the dividend yield was a good approximation of shareholder yield (also known as payout yield).
Since then, however, the dividend yield has become less of a good proxy for payout yield, since companies have increasingly turned to buybacks as a way of returning cash to shareholders. In order to focus on payout yield, therefore, it has become crucial to include both dividends and net buybacks in the calculations!
This is often forgotten - always forgotten (?).
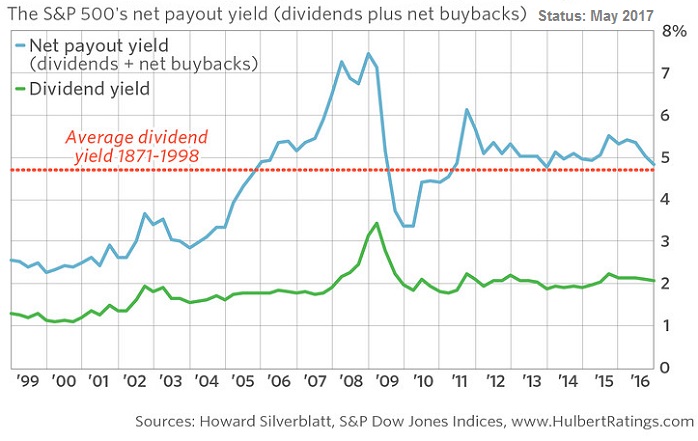
Consider the last quarter of 2016, which is the most recent quarter for which S&P Dow Jones Indices has data. The S&P 500's buyback yield (based on net buybacks during the quarter) came in at 2.79% - larger than the S&P 500's dividend yield of 2.06%. >>
>> Taken together, that meant that the S&P 500's net payout yield stood at 4.85% (See chart above).
To put that in context, consider that the dividend yield averaged 4.73% during the prior decades in which dividends were the primary way in which companies returned cash to shareholders. (This average is based on data back to 1871 from Yale University’s Robert Shiller, and extends up to 1998, which is when the accompanying chart begins.)
In other words, the S&P 500's recent shareholder yield is slightly above what used to be the long-term average for the dividend yield. While that doesn't constitute an outright buy signal, it paints a far more optimistic picture than the screaming sell signal that the dividend yield itself has been issuing for the last two decades.


