Related Categories
Related Articles
Articles
Stock Market Returns Over Different Time Periods (1872-2018)
1 year and 20 years (!)
"Rolling Periods"
Across the entire period spanning from the year 1871 until February 2019, U.S. stocks have increased at +9.0% per...
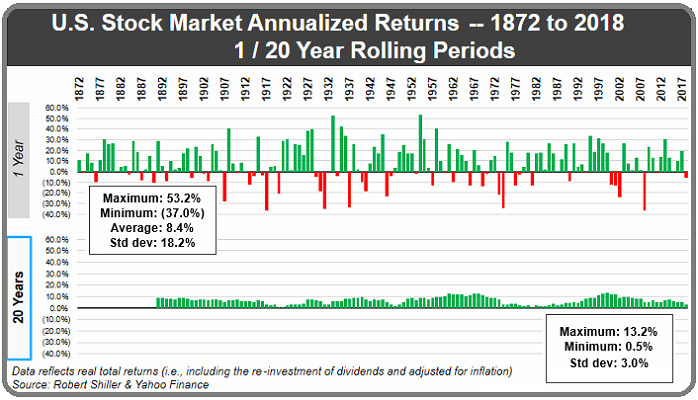
...year including dividends. Note: when we refer here to the "U.S. stock market", this refers to the S&P Composite index from 1871 to 1957, and the S&P 500 index from 1957 until today.
U.S. stock market returns in any single year can be extremely volatile. The market has lost between 30% - 40% in five different years (1917, 1931, 1937, 1974, 2008), while the market has gained more than 50% twice (1933 and 1954).
Buy, (just) Hold & Profit?
The wild swings of the market are reduced if we start to consider time horizons that are longer than a single year. In the barcharts above, you can see how U.S. stock market returns have trended when we look at 1 and 20 year rolling periods.
A Reminder:
Historically, buying and holding (and potentially forgeting about the investment entirely) has been a simple and straightforward way to build wealth. OR -as always- Warren Buffet put it best: "the stock market is a device for transferring money from the impatient to the patient."
Recap:
Taking a 1-year view, we see lots of red in the picture above - i.e., there were plenty of years in which the market was down. As we take a longer time period (up to 20 years), the chance of losing money diminishes...Eventually once we zoom it out to look at 20-year periods, you won't see any more flashes of red. Put differently >>
>> The U.S. stock market has never lost money over any 20 year period <<
links:
https://themeasureofaplan.com/us-stock-market-returns-1870s-to-present


