Related Categories
Related Articles
Articles
Bonds in a rising interest environment (History)
Allocation to Bonds When Current Rates Are Low? The performance of bonds is related to movement in interest rates. Those two phenomena are related - that much we know. This posting reviews how interest rate movement and bond returns have..
...been related to each other since 1948.
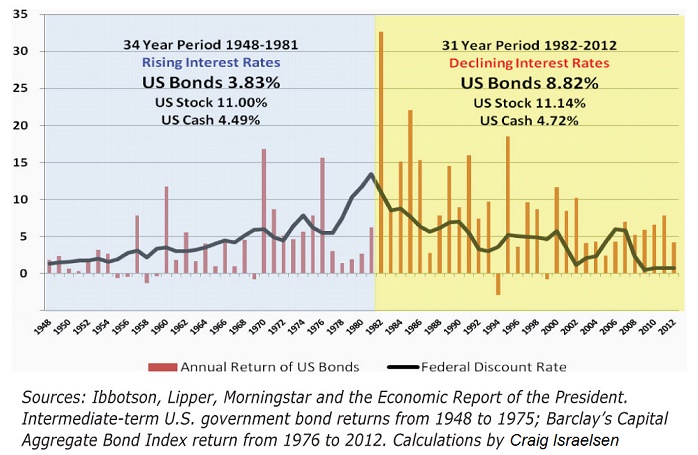
Over the time period 65 years (1948–2012) interest rates have risen, and then fallen. During the 34-year period 1948–1981, the Federal Reserve's discount rate increased-not every year, but as a general trend. In 1948, the Federal Reserve's discount rate was 1.34% and by 1981 it was 13.42%. During this time frame of rising interest rates, the 34-year average annualized return for U.S. bonds was 3.83%. The year-to-year performance of U.S. bonds is represented by the vertical bars. U.S. bond performance is represented by intermediate-term U.S. government bond returns from 1948 to 1975 and the Barclay's Capital Aggregate Bond Index returns from 1976 to 2012.
As shown in the diagram above, the Federal Reserve's discount rate began its descent in 1982-not falling every year, but generally in decline. At the end of 2012, the rate was 0.75%. During the long period of 31 years (1982–2012) the average annualized return of U.S. intermediate bonds has been 8.82%.
Clearly, these 31 years have been a wonderful environment for bonds to perform well as the Federal Reserve's discount rate steadily descended. One could call this the: Kindergarden-period for BOND-Investors (and Real-Estate Investors ; -) Interestingly, U.S. stocks (as represented by the S&P 500 index) performed essentially the same during both periods. From 1948 to 1981, when interest rates were rising, the S&P 500 index had an annualized return of 11.00%. During the recent 31-year period of declining interest rates, the S&P 500 index generated an 11.14% annualized return.
Whereas bond returns are markedly impacted by interest rate movement, stocks are largely immune-indeed, stocks march to a variety of different drummers. Furthermore, cash (as represented by the three-month T-bill) averaged 4.49% during the 34-year period of rising interest rates, and 4.72% during the 31-year period of declining interest rates.
Recap for the more recent decades
In more recent years, interest rates rose from 1.17% in 2002 to 5.96% in 2006-only to be followed by a period of declining rates from 2007 to 2012. Over the 11-year time frame 2002-2012, the performance of these particular fixed-income indexes was surprisingly similar between the two periods (when rates were rising and when rates were falling). It is worth noting that at its peak in 2006, interest rates were still under 6%. In contrast, interest rates peaked at over 13% in 1981. This would suggest that bond performance has not simply been related to changes in the interest rate, but also to the absolute level of the interest rate. Said differently, the rise and fall of interest rates in the most recent past has not produced nearly the difference in bond index performance as during the late 1970s and early 1980s.
One clear take-away is that during periods of rising interest rates, there can be dramatic performance variation among fixed-income indexes. As would be expected, longer-maturity indexes will suffer more when interest rates rise. That said, in recent years this particular relationship has been less dramatic.
Performance in a Portfolio
A one-asset portfolio that held only U.S. bonds (U.S. intermediate-term government bonds from 1948 to 1975 and the aggregate bond index from 1976 to 2012) was clearly impacted by the interest rate movements during that particular period of time.
During the 34-year period of rising interest rates from 1948 to 1981, a non-diversified all-bond portfolio averaged 3.83% per year, whereas during the last 31 years it produced an average annualized return of 8.82% (see Table above). The difference in return for an all-bond portfolio during these two distinct time frames was a staggering 499 basis points.
How about a two-asset portfolio? (60/40)
Let's assume the classic "balanced" design with a 60% allocation to stocks (S&P 500 index) and a 40% allocation to bonds (rebalanced annually). The difference in performance between the two time periods (1948-1981 and 1982-2012) is much less dramatic for the two-asset portfolio, though bond performance was clearly favored in the more recent 31-year time period (up until the year 2012). The performance difference of 499 basis points (ca. 5%) in the all-bond portfolio shrinks to
a 204-basis-point (ca. 2%) difference in a 60% stock/40% bond two-asset portfolio (10.56% vs. 8.52%).
Quick n dirty conclusion
If the 15-year-period from 1987-2012 is any sort of indicator of the future, building a broadly diversified retirement portfolio is both prudent and might even be logical-and beneficial. In short, the era of simply diversifying among two asset classes (stocks and bonds) is over. The good news is this: With an ever-expanding array of exchange-traded funds (ETFs) that represent all manner of asset classes, it may have never been easier to build diversified portfolios!


