Related Categories
Related Articles
Articles
What's the Worst 10 Year Return From a 50/50 Stock/Bond Portfolio?
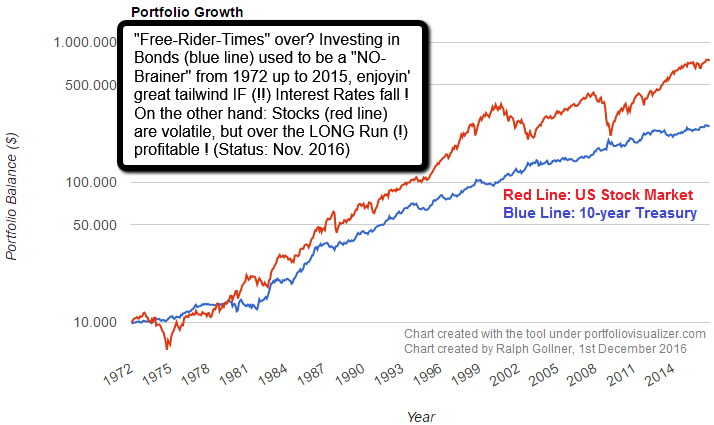
Here my chart from 1972 up to Oct. 2016. I then had the idea to research for possible "hard periods before". I finally found an answer to my question about what the worst 50/50 portfolio of stocks and bonds...

...would look like. I found some research on the internet: Mr. Ben Carlson decided to run the numbers. But before showing the table with the Rolling-Returns for a 10-year period of a fifty/fifty portfolio made up of stocks & bonds, please take a look at the Compound Average Returns for each of the two assets since 1972:

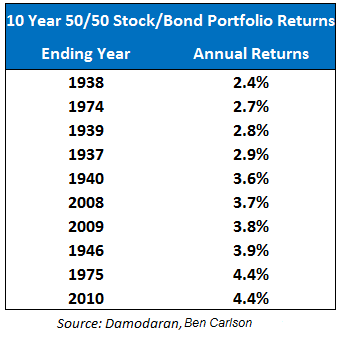
Next, as already promised, are the results for the fifty/fifty - portfolio using 10 Year Treasuries as the bond proxy: The worst 10 year period for a simple 50/50 portfolio, rebalanced annually, was just over 2% per year.
This is pretty unbelievable if you think about it. Remember, the crash during the Great Depression saw stocks fall nearly 90% from top to bottom. Even with those enormous losses and one of the worst U.S. economic contractions in history, a diversified portfolio still gave investors positive returns over a decade. Obviously, to earn those returns required nerves of steel to rebalance on an annual basis and resist selling out at the bottom. Same as it ever was.
Since the gentleman who carried out these calculations measures his own time horizon in multiple decades he decided to take this analysis a step further and see what the worst 20 year rolling returns would be for this same 50/50 portfolio - those results can be found in the link I posted at the end of this article.

Under the link given below you will find the top ten (bottom ten?) worst 20 year returns for a 50/50 stock/bond portfolio using the time frame "20 years". Save for the 1947-49 end points, the rest of these returns are pretty respectable. The fact that none of these 20 year return numbers came anywhere close to being negative should tell you something about the power of long-term patience with your holdings.
In fact, the average rolling 20 year return for this 50/50 portfolio historically was 8.6% (the median was 8.2%). Also, the standard deviation of the rolling 20 year returns was only 2.4%, meaning not a ton of variation in those numbers. Again, most of the worst returns contain a horrible economic event, but over any 20 year period you can expect at least one crash or mini-crisis and possibly more. Prepare yourself psychologically beforehand so you don't lose your discipline at the wrong time.
The usual caveats apply here - these numbers are before inflation and fees are taken into account. Also, it's unlikely anyone will build a portfolio using only the S&P 500 and 10 Year Treasuries. And no one knows what the returns will look like in the future.
Still, using historical data to understand past risks (potential gains and losses) and a correct view of your time horizon can be helpful when building a portfolio or thinking about making short-term moves with long-term capital at stake.
link for the mentioned 20-year-period calculation: http://awealthofcommonsense.com/2014/04


