Related Categories
Related Articles
Articles
Sectors - Performance U.S.A. (1999 - Nov. 2016)
Earnings & Sector-Performance (!)
It is always interesting to see, that investors forget that it is more about sticking with the right sectors than picking the right stocks at the right time. In theory most know that...
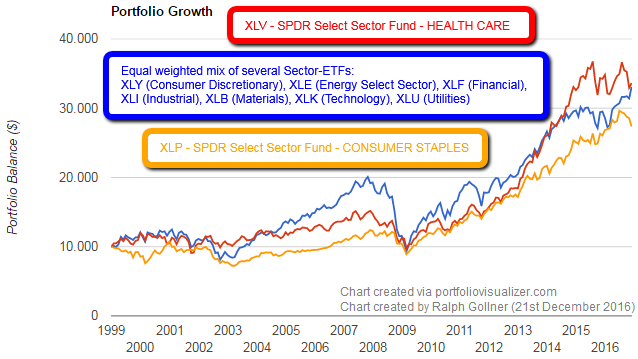
But the chart above only gives you an idea of the possible returns over a long period from the year 1999 (shortly before the .COM-BUST) through the financial crisis in 2008, 2009 unitl Nov. 2016, when the presidential election of Donald Trump took place. In the next table you will see the average annual returns, expressed in CAGR (Compound Average Growth Rate) for the three different strategies, sector-selections I showed above:

One can clearly see, that sticking only to the Health Sector (Pharma, Med-Tech, etc.) would have returned the best performance with less volatiltiy ("Standard Deviation"), than a Sector-Mix including Industrials, Technology & Co. On the ohter hand a Buy & Hold-Strategy only via the sector-ETF "XLP" (Consumer Staples, like Mc Donald's & Co.) would have resulted in a return number of ca. 5.78% over that long timeframe (from Jan. 1999 onwards).
It should be noted and now it should be clear that stocks and sectors follow their fundamental path, which means: Cash Flows, Earning numbers. This can clearly be seen by the next four charts, which should give you an idea about the earnings volatility in each of the four given sectors:

The difference between Consumer Discretionary and Consumer Staples (Foods & Drinks) is extremely clear. To get another idea I also want to show the difference between the rattled Financial-Sector and the real LONG-TERM-TREND-SECTOR Health (Pharma, MedTech, etc.):

Pretty obvious which sectors are risky, but short- and medium term chances are high - and on the other hand more boring sectors with stable earnings, but less upside potential in the near term...


