Related Categories
Related Articles
Articles
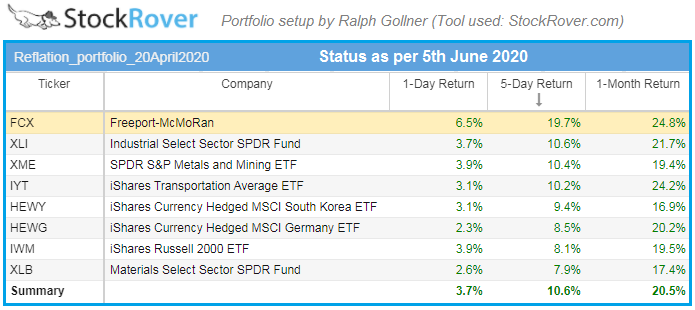
the REFLATION TRADE is on
(Status: 5th June 2020)
The Fed's aggressive stimulus measures, along with other central banks', are having the desired effect of reducing risk premiums and reflating risk assets. The "reflation trade," involving the most...
...economically sensitive assets, confirms that the central banks' actions are working.
Currently (especially now in the first week of June 2020), the market is loudly saying the Fed Bazooka worked to turn the tide, and risk assets are going higher.
The Fed "reflates" the economy by injecting liquidity to stimulate borrowing and reduce risk premiums. Historically this has been accomplished by lowering rates, and today it's being implemented through lower rates and QE. It's important to note that in previous bear markets the Fed gradually stimulated the economy by slowly cutting rates. If this bear market was much shorter than other bear markets, it's because the speed and magnitude of Fed actions in March dwarfed anything previously done.
The reflation trade is STILL working
When the Fed is effectively reflating the economy, the most cyclical assets in the market break their downtrend and start forming uptrends. This is called the reflation trade. The definition of the trade isn’t taught in universities but is widely understood in the macro world. The most common economically sensitive assets used by macro investors for this trade are Copper (HG1), Materials (XLB), Miners (XME), Transports (IYT), Small-caps (IWM), Germany (EWG) and South Korea (EWY).
Recap: risk assets across the board were in a well defined downtrend until 23rd March 2020. After the Fed and US government introduced record stimulus, risk assets reversed course. The most economically sensitive assets, the reflation trade, is in a new uptrend. There aren’t any cyclically sensitive assets that remain in a downtrend. Some investors will point to spot oil prices making new lows, but that situation is muddied by oversupply from OPEC. Besides, the longer-dated oil futures bottomed in March and have not made new lows.
One favorite barometer for reflation might be the stock Freeport-Mcmoran (FCX) because it’s a large cyclical miner with underlying exposure to copper which itself is highly cyclical. In 2009, FCX stock was an effective barometer to understand when the market started to signal that the reflation trade was working. In 2008, FCX was in a clear downtrend. After incrementally aggressive actions by the FED and Treasury department, FCX stock broke its downtrend in January 2009 and started a new uptrend.
The bond elephant in the room
(the difficult scenario)
If the Fed has successfully started to reflate the economy as many assets suggest, the bond market needs to confirm this trend. Bond yields were trading near historical lows through the month of May 2020, with the 10-year yield at ca. 0.65%.
In a reflationary environment, the yield on long term bonds like 10Y and 30Y should increase, and the yield curve should steepen. As bond yields move higher, bond-like equities with high dividend yields like Utilities will likely underperform.
Historically, the start of QE has led to higher yields. If bond yields don't start moving higher in the near future, this would or could be a major signal that the reflation trade is NOT working!

What eventually happened in the last 5 days (status: 5th June 2020, After Market-Close)
Investors are refusing to hang around for a U-shaped recovery and are putting money to work straight away. The US Treasury curve is steepening and money is flowing back into emerging markets (as can be seen in the chart above).
This has been a huge week for the reflation trade as investors refuse to hang around for a U-shaped recovery and are putting money to work straight away. After all, the point of quantitative easing is to drive investors out along the credit curve. This story has been most evident this week in the 15 basis point steepening in the US 2-10 year curve - reminiscent of the moves seen in March 2009 when confidence finally returned to the market. IIF data also shows the biggest weekly portfolio inflow into Emerging Markets since early February.
link (Status-Quo Recap as per 5th June 2020):
https://think.ing.com/articles
link (20th April 2020 - article):
/www.koyfin.com/research/2020/04/20


