Related Categories
Related Articles
- Entscheidungsfindung/Asset-Allocation
- Asset Allocation (annual performance/history)
- Decade Returns 1930 through 2009
- Portfolio-Example (what is possible?)
- Asset Allocation (minimum loss year 1/25)
- Ray Dalio about Asset Allocation
- Asset Allocation (annual performance/2003-2015)
- Dividend payers - Portfolio selection (Backtest)
- Minimum Varianz (1. Versuch), 1996 - 03/2016
- Intermarket (Snapshot/different Assets)
- Paulson (Berühmter Hedge-Fonds)
- Warren Buffet vs S&P 500-ETF vs Hedge Funds
- Momentum Strategy (strong sectors)
- Lifetime-Investment-Strategy (source: AAII)
- S&P 400 Total Return (great Index)
- Umfrage unter österr. Vermögenden (Asset Allocation)
- Top 100 BrandZ 2015 (Performance Recap)
- Great Portfolio 1 (CAGR: > 24% p.a.)
- Buy & Hold Skyrocket-Portfolio
- Buy & Hold-Strategie (Ralph Gollner)
- Ralph Gollner vs. BC-Zertifikat
- Ray Dalio versus ZUKAL und W. Buffet
- AbsoluteReturn-Ansatz vs. Ray Dalio
- Anlagestrategien (exemplatisch 02/2016 - 08/2016)
- BOFA Fund Manager Survey (Aug. 2016)
- George Sors & Carl Icahn
- Hedge Fund (Paul Tudor Jones)
- AFA statt FANG
- The S&P 500-Timing-Portfolio (1996 - 08/2016)
- Asset Allocation (Bsp. aus Juli 2016)
- DAX (7 Aktien), Experiment (Backtest)
- David Blood, Al Gore - Sustainable Capital.
- Correlation between stocks
- Has Warren Buffet Lost His Appetite?
- Warren Buffet versus Indices, ETFs
- Magic ("lower") Risk - Stock-Portfolio (2004 - Sep. 2016)
- Minimum Vola-Strategien (Zertifikate, ETFs, etc.)
- Watch out for the BIG ROTATION (Trump-effect)
- Timing Strategy (Risk-reduction Stock-Markets)
- The power of a diversified "US-biased" Portfolio
- Inflationproof (?) ALLWETTER_Portfolios ('03-2016)
- Das "Marktportfolio" (Status: 2015)
- Benjamin Graham on "Asset Allocation"
- Who or what is Renaissance (Competition ;-)
- Initial investment and contributions (ca.7 years)
- US Stock Market vs. 10-year Treasury (1972 - 2016)
- Pensionsfonds Global und AT
- ETF-Savings/Investment Plan (2007-Nov. 2016)
- Sectors - Performance U.S.A. (1999 - Nov. 2016)
- Real-Word-Diversification (2003 - 2015)
- Anlegerverhalten (Umfrage 2016)
- Factors (Value, Size, Momentum) vs. Correlation
- DAX (8 Aktien), Experiment (Backtest)
- Most Admired Companies Survey (Fortune)
- 25Jahres-Perioden (US-Aktienmarkt)
- Long-Term Investing (Recheck Kelly-formula!)
- Der Value-Zyklus (NOW?!?)
- Zufriedenheit mit einer positiven Rendite...
- Branchen-ETF (some risk, some fun?)
- 30years (starting point: Check out the P/E)
- Backtest (March 2009 - 2016)
- Sortino-Ratio (Portfolio-Backtest)
- USA (Home-Bias), period: 1975-March 2017
- Österreicher und "Die Aktie"
- ÖBIB (Österreich)
- The "connected cars" market
- DAX-Sparplan - Szenario bei "Worse Case"
- Berkshire Hathaway versus Renaissance Techn.
- Vermögensaufbau (Rendite, Risiko)
- Sparplan-Simulation auf den DAX (2015 - Juni 2017)
- Combining Value & Momentum (!)
- rG versus Warren Buffet (*ggg*)
- Walter Schloss (record)
- Retirement & Dividends
- Investitionsquote "Aktien" (Mag. R. Gollner, skizziert)
- "The Permanent Portfolio"
- Deutsche Staatsanleihen (Reale Verzinsung neg.)
- Top BrandZ 2017 - Selection from Top 100
- Cost of Capital (WACC)
- Ansparplan - langer Anlagehorizont
- Immobilienmarkt Österreich (Wien)
- XLB (US-Materials Sector)
- Bonds in a rising interest environment (History)
- Definition einer dynamischen Investitionsquote
- Well, he admits it...
- Billy Axman (Bill Ackman)
- Bonds vs. Stocks (Warren Buffet)
- Dynamische Investitionsquote (23. März 2018)
- Swimming naked...
- The period 1982 - 1999 (Kindergarden)
- 10year US-Treasuries and Dow Dividend Stocks
- Two rivals of the U.S. Stock Market
- Warren Buffet vs. Carl Icahn (2010 - Apr. 2018)
- Portfolio "German-Austrian"
- GAFAM (sehr konzentriert, Risky Risky)
- German-Austrian (Mag. R. Gollner)
- 5 US-Stocks Portfolio (High Risk, Annual Rebalancing)
- Möglicher Anlagezeitraum (30 Jahre?), Lernkurve
- Roboter und Marketing (...)
- Mission Impossible 2019 - 2028
- "German-Austrian" (Mag. Ralph Gollner) vs. DAX
- Oakmark vs. Warren Buffet vs. Danaher
- Julian Robertson ("Tiger")
- QQQ & ^Gold "Timing Portfolio"
- The Race For AI (Status: Q1-2018)
- "German-Austrian" vs. "LieberMann-Strategie"
- David "Unicorn" and some downturn...
- Asset classes / History
- Returns and Standard Deviation (1956 - 2015)
- Wiener Zinshausmarkt versus Aktien (?)
- Spin-off (Investment opportunity ?)
- Time is over: Warren Buffet (?), July 2018
- Venture Capital (magic returns?)
- US Top 10 companies
- Hanni-Börsday :-)
- David Einhorn is losing (Status: Sep. 2018)
- All we need is just a little patience...
- Piotroski F-Score (Backtest)
- Privater Zins-Tilgungsträger (2018 bis 2034)
- ETF-Cocktail (Backtest since my birthday ;-)
- Backtest of 8 US-Stocks (2002 - Sep. 2018)
- Gr8 Outperformance versus S&P 500 ('95 - 2018)
- Nachhaltige Geldanlage (2002 - Sep. 2018)
- Deutsche Anleihen(Rendite nach Inflation), 2018
- Ich baue mir (m)eine Privatpension (Jahr 2018)
- Meine Aktien-Investitionsquote (Dez. 2018)
- US-Equity Risk Premium (Dec. 2018)
- Ralph vs. Warren Buffer & Oakmark funds
- Investmentfonds-Methusalem (1934ff)
- "BASM" (Fred Kobrick)
- Stock Market Returns (U.S. stocks)
- U.S. Stock Market Returns by Decade
- Top Brandz (2018)
- Global GDP-Growth (source: OECD-Video
- Trump and the Trend-Followers (freaky stuff)
- Long-Term-Investing (20 years+)
- Bond yield versus Dividend yield
- Aktienquote in einem Portfolio (26.03.2020)
- M/eine Aktienquote (7. April 2020)
- Aktien-Investionsquote & Covid-19
- Reflation Trade (5th June 2020)
- Aktienquote per Mai 2020
- BLACK SWAN-BACKTEST (2010 bis Jänner 2020)
- LIRP-environment & Cash-yields (year 2020)
- Asset-Allocation (Crypto-Cocktail)
Articles
Dow Jones Ind. Average-components (1999-10/2016)
(9 selected stocks of the DJIA-universe)
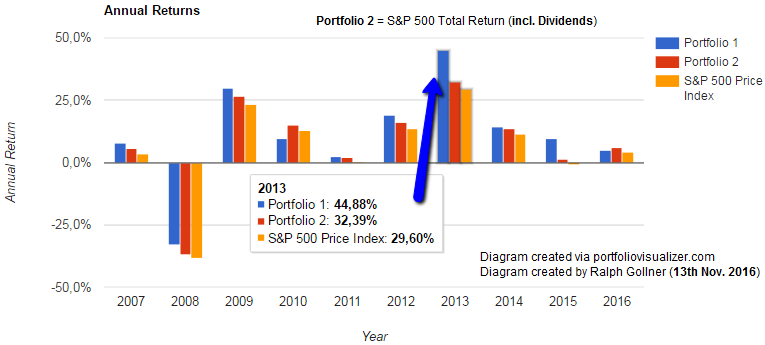
In the last years, but also in the recent decades, people want to call the "BUY & HOLD"-Strategy over and gone. Well, following charts might tell a different story. Take a look:
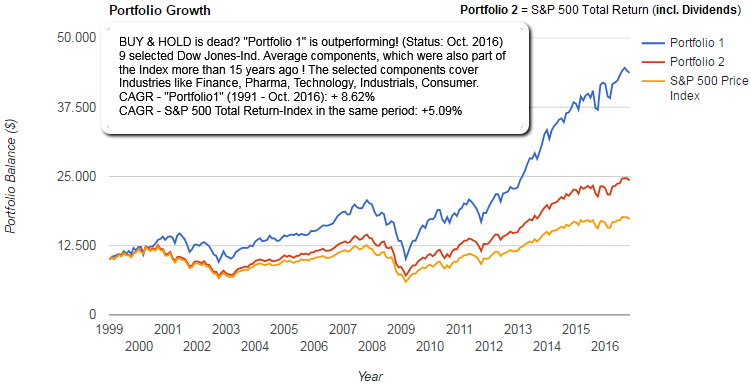
The "Portfolio 1", consisting ONLY of 9 selected Dow Jones Industrial Average-components which were also part of the DJIA back in the year 1999 (!), before the .COM-Bubble finally burst is still holding up strong against its own mothership, the Dow Jones IA, but also against the very broad Stock-Market, indicated by the S&P 500 (Price Index, and Total Return). The following diagram shows how this "Buy & Hold"-idea performed from 2007 until Oct. 2016:
In the last chart one can see a selection of 17 Dow Jones IA-components which outperformed the Dow Jones Industrial Average in the last 5 years (period covered Oct. 2011 - Nov. 2016):

Here a selection of these 17 stocks and sectors they are covering:
IT
aapl (consumer)
msft
csco
Pharma
pfe
jnj
mrk
unh
Finance
trv
--GS (incl. in the DJIA after the year 2000)
jpm
--V (incl. in the DJIA after thh years 2000)
Industrials
mmm
ge
ba
Consumer
nke
dis
hd
Dow Jones Industrial Average-components "Come & Go": http://graphics.wsj.com/djia-components-history
Wanna do your own homework? then check out the tool: www.portfoliovisualizer.com


