Related Categories
Related Articles
Articles
Asset Allocation (minimum loss year 1 out of 25)
investment period: 1975-1999
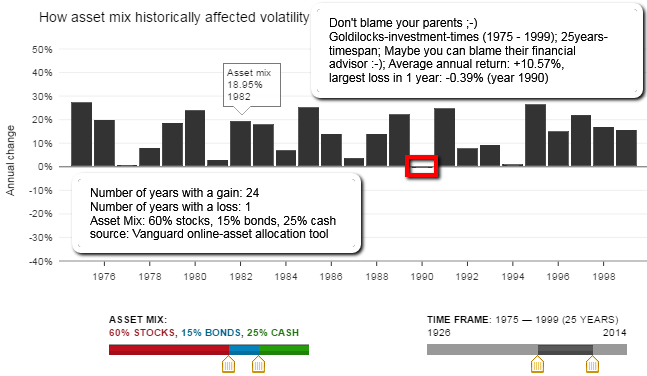
A sound investment strategy starts with an asset allocation suitable for the portfolio's objective (following example shows a LOWER-Risk/High-Return Asset Mix and its performance in the Goldilocks-period 1975-1999):
The allocation should be built upon reasonable expectations for risk and returns, and should use diversified investments to avoid exposure to unnecessary risks.
Both asset allocation and diversification are rooted in the idea of balance. Because all investments involve risk, investors must manage the balance between risk and potential reward through the choice of portfolio holdings. In the following overview one can find the ups & down (only 1 year) of the Asset-Mix strategy in the 25-year-period shown; Only one year ended with a loss - therefore fulfilling the need of "felt safety" for the average ("nervous") investor :-)

Comment for the Asset-Mix applied in this example: A diversified portfolio's proportions of stocks, bonds, and other investment types determine most of its return as well as its volatility. Attempting to escape volatility and near-term losses by minimizing stock investments can expose investors to other types of risk, including the risks of failing to outpace inflation or falling short of an objective. Realistic return assumptions - not hopes - are essential in choosing an allocation. Leadership among market segments changes constantly and rapidly, so investors must diversify both to mitigate losses and to participate in gains.
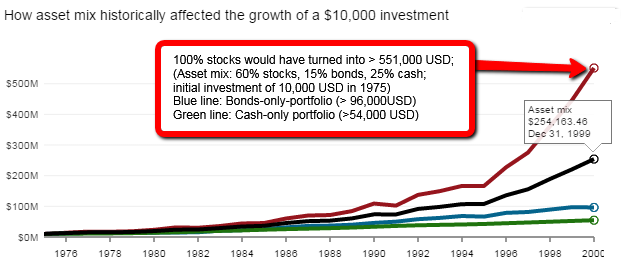
If one had followed a reasonable Asset-Mix for a 20-year+ investment horizon, therefore applying reasonable assumptions in choosing an allocation one would have reached a satisfying performance for covering the risks (please see performance chart above - showing the perf. of the different asset-classes and the chosen asset-mix).
To wrap up history, for example, over the history of the capital markets since 1926, U.S. stocks returned an average of 10.2% annually and U.S. bonds 5.5%. For this 87-year period, a half-stock, half-bond portfolio would have returned 8.3% a year on average if it matched the markets' return.
But look at a shorter span, and the picture changes. For example, from 1980 through 2013, U.S. stocks returned an average of 11.7% a year, while bonds returned 8.2%. A portfolio split evenly between the two asset classes and rebalanced periodically would have generated an average annual return of 10.3%. As you can see, anyone with such a portfolio over this particular period could have earned 2 percentage points a year more than the long-term historical average. Contrast that with the period from 2000 through 2013, when U.S. stocks provided a 4.3% average return and U.S. bonds 5.7%; then the same balanced portfolio would have averaged 5.6% a year.
online-tool: https://personal.vanguard.com


