Related Categories
Related Articles
Articles
S&P 400 Total Return (great Index)
MidCap-stocks usually outperform in the long run. The academic answer is that smaller companies are riskier and therefore command a higher risk premium (aka trade at a discount to 'safer' large cap stocks).
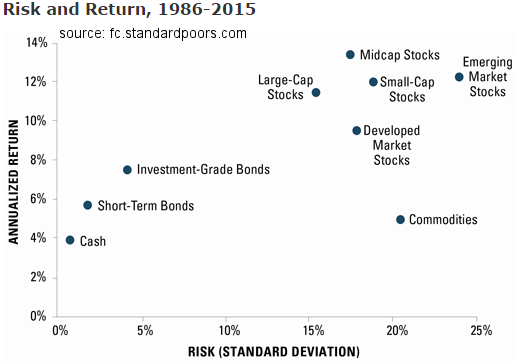
The chart above shows the risk and return of various asset classes over the past 30 years. The performance shown includes reinvestment of any income or distributions. Large-cap stocks are represented by the S&P 500 index. Midcap stocks are represented by the S&P MidCap 400 index. Small-cap stocks are represented by a composite of the CRSP 6th-10th decile portfolios and the S&P SmallCap 600 index. Developed market stocks are represented by the MSCI EAFE index. Emerging market stocks are represented by the MSCI Emerging Markets index. Investment-Grade bonds are represented by the Barclays U.S. Aggregate index. Short-term bonds are represented by the Barclays 1-3 Year Government/Credit index. Cash is represented by a composite of yields on 3-month Treasury bills, published by the Federal Reserve, and the Barclays 3-Month Treasury Bills index. Commodities are represented by the S&P/Goldman Sachs Commodities index.
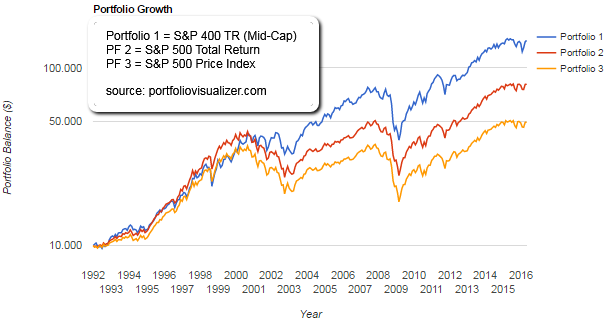
I also made my own calculations with the S&P 400 Mid-Cap Total Return Index (includes dividends). 10,000 USD invested in the year 1992 led to a final balance of USD 142,700 by April 2016. This great outperformance against the S&P 500 Price Index (unfair, since NO dividends were incl. in that computation) and versus the S&P 500 Total Return (fair, since this index also includes the dividends like the S&P 400 TR) is really stagering:
11.54% annual return (S&P 400 TR) versus 8.98% annual return (S&P 500 TR)
Final Balance: kUSD 142,7 versus kUSD 81 (starting with kUSD 10 in the year 1992)
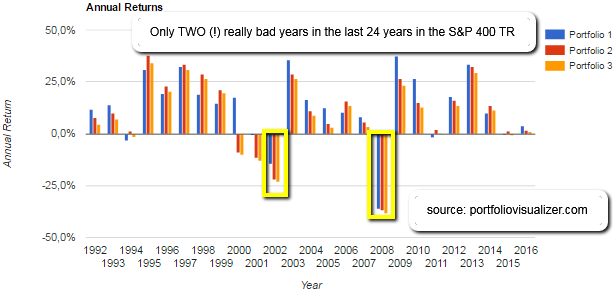
But the foremost important information -especially for us, "the nervous investors"- is, that there were only TWO (!) really heavy downturns to digest in the last 24 years (from 1992 onwards), namely: in 2002 and 2008. Still, the Minus of ca. 14.5% in the year 2002 is not that bad in the light of Minus 22.1 % of the S&P 500 TR the same year:
links for computations/graphs:


