Related Categories
Related Articles
Articles
Correlation between stocks
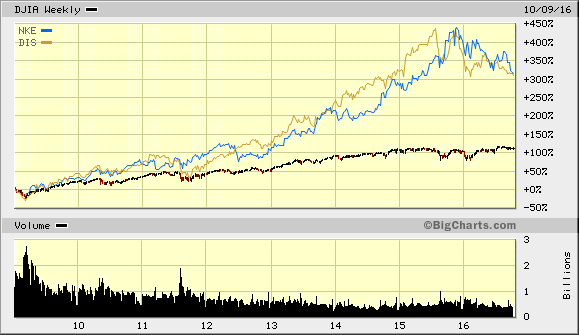
Investors want to minimize the risk associated with a given expected return. Diversification can play a role by minimizing firm-specific risks. Example: Nike and Disney had a fabulous run from 2009 up to Aug. 2015 - but then something happend:

When you add new assets to your portfolio, you are adding the possibility that they will do well during the times your existing assets perform poorly, and vice versa. So without changing your expected return, you are able to lower the variability of returns. In fact, through careful selection of assets to add to your portfolio, you can eliminate most firm-specific risk, which is sometimes called non-systematic risk, and bear only market, or systematic, risk to your portfolio.

Your ability to reduce firm-specific risk in a portfolio depends on the relative correlation of the assets held in the portfolio. Correlation describes the degree to which returns on investments move together. Let´s think about an example, where the investor was able to increase the expected return of his portfolio (from 12.20 percent to 12.59 percent) and actually reduce the risk as measured by standard deviation (from 9.88 percent to 9.52 percent) by adding an additional stock to the portfolio. The primary reason for this simultaneous reduction in risk and increase in expected return was a low correlation of the returns of Stock "A" and Stock "B" (for example: 0.3).
If one takes this example into "real-life" one may think about investing in components of the well known "Dow Jones Industrial Average". But instead of investing in a basket of 30 stocks, one may end up in choosing only 6 or 12 stocks, etc. to build ones own Stock-Basket - in order to achieve a higher return than the "average benchmark".

As one can easily see in the "Rolling 120-day Correlation" chart above that the correlation between the Disney-stocks and the Nike-stocks is fluctuating over time. The most straight forward explanation behind the observation may be, that both companies are operating in different industries. Disney is operating in the Entertainment Industry (in which new entrants into the TV-space, like Netflix, Amazon may pose a threat), whereas Nike is active in the Textile / Apparel Footwear & Accessories-Sector (in which "new" entrants like Under Amour are becoming strong competitors and Adidas may regain strenght again). Taking only these factors into consideration one can understand, why the underlying stocks of these two companies sometimes move in the same direction (Correl > 0.6), but sometimes also experience a lower positiv correlation. Still, depending on the tailwind of the overall economy (economic growth, consumer spending, etc.) both companies should definitely gain from a global strenght in economic growth (Correlation > 0.1).

The Disney-stocks and the Nike-stocks are components of the famous Dow Jones Industrial Average.The Dow Jones Industrial Average has been computed from year 1896 onwards and now carries 30 components in its Index. These 30 companies cover (more or less) most sectors of the economy and should give a quick and easy picture of the current state of the "Market".
A broader Stock Market Index is the S&P 500 (Standard & Poor´s 500), which covers 500 companies from all branches of the economy and should give an even better, more detailed picture of the current stock-market. To compare the standard-deviation (fluctuation of the stock-performance over time) to another Index like in the chart above (DIS versus S&P 500) gives you an understanding how correlations between one specific stock and the broader Stock-Market can change over time. Still, the correlation between Disney and the S&P 500 might have stabilised in the last years in a corridor between + 0.5 and + 0.75). Remark: Correlations above 0.7 indicate pretty strong positive correlations.

Having mentioned the Dow Jones Industrial Average (30 components) and the stocks of Nike and Disney I wanted to give comment how all three curves developed over the last years. In the first chart of this posting one could clearly see, that over a timeframe of ca. 7 years "The Walt Disney Company" and "Nike" outperformed its underlying Index (DJIA) by far. The DJIA doubled (more or less) since the low of 2009. One should also keep in mind, that in the stock-curves above NO (yearly) Dividends (direct cashflows to the investor) were included or indicated.
Remark on dividends: Dividends are paid (in the US mostly on a quarterly base) directly to the investor in cash and normally range in a corridor between 1% and 3% per annum (> 1% should be more than most saving-accounts pay you nowadays...).
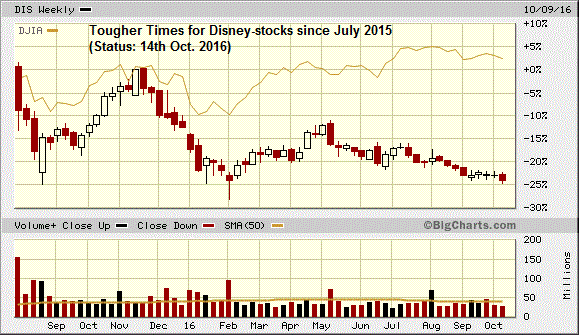
One can conclude, that for these two specific stocks (DIS, NKE) the period from Summer 2015 until now (Oct. 2016) has been pretty tough. In the year 2016/year-to-date both stocks have delivered a very weak performance - both stocks are in the red (double-digits-Minus!).
Still, over a 7-years-timeframe (2016 - 2023 ; -) I believe that the management of both companies should find ways to RE-create shareholder-value. Still - the future is uncertain and risky!
Disclaimer: Ralph Gollner hereby discloses that he directly owns securities of DISNEY-stock as well of NIKE-stock. Both are subject of the commentary, analysis above (as per 14th Oct. 2016).
links
More Infos on correlation, risk diversification, etc.: http://ci.columbia.edu/ci/premba
Short article on correlation: www.prudentnetwork.com/prudent-perspective/correlation


