Related Categories
Related Articles
Articles
Factors (Value, Size, Momentum)
versus Correlation
Looking over the past 15 years of factor returns for value, momentum, and size, one can see a pretty consistent picture of outperformance, and in some cases quite sizeable outperformance. We'll call these "alpha factors"...
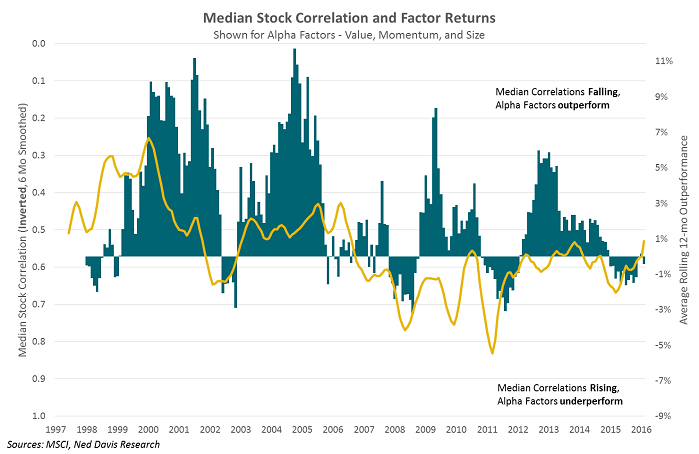 *12-Month rolling average excess returns (vs MSCI USA) for MSCI USA Enhanced Value, MSCI USA Momentum, and MSCI USA Size Tilt indexes are shown against the 6-month average of median S&P 500 1-day correlations over the past trading quarter.
...as their general design is to outperform indices overtime, typically as stocks rise.
The chart above illustrates this outperformance relative to the parent MSCI USA Index. Overlaid on top is the median intra-stock correlation in the S&P 500 Index, inverted (orange line - correlation falling, therefore the orange line is now rising...). So as correlations between stocks fall, the security selection that the alpha factors provide leads to outperformance, and vice versa.
On the flip side, let's look at quality and minimum volatility, factors we’ll call "risk factors" for their focus on managing risk and typical outperformance to the downside. The median stock correlation is no longer inverted on this chart, as rising correlations signify outperformance for these factors. Intuitively it makes sense, in periods of market stress correlations "go to 1" and money flows into the seeming safety of the holdings in these factors.
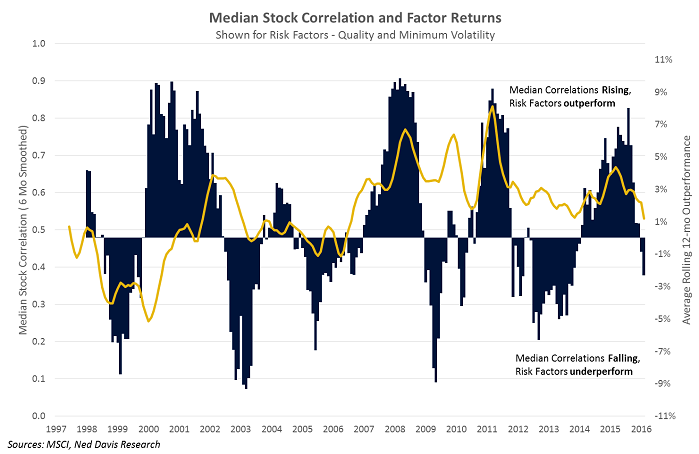 *12-Month rolling average excess returns (vs MSCI USA) for MSCI USA Quality and MSCI USA Minimum Volatility indexes are shown against the 6-month average of median S&P 500 1-day correlations over the past trading quarter.
In the last years - Active Fund Managers had an extremely hard time to beat their benchmarks. Eventually most of them failed...
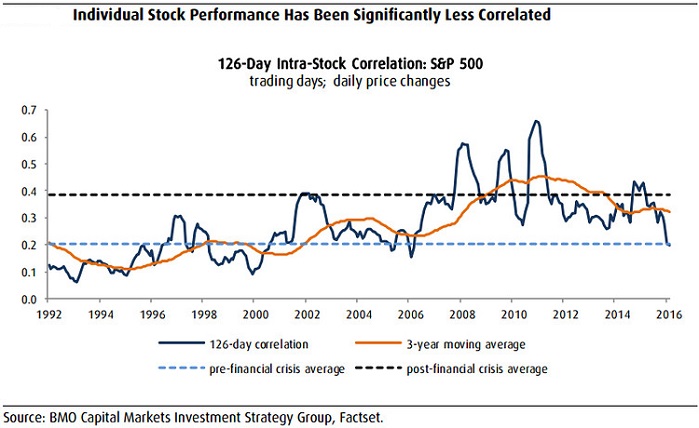
The good news for active management (and alpha factors for that matter) is that intra-stock correlations have plummeted to the lowest level in over 10 years. The potential for rising interest rates and diverging global monetary and fiscal policies should lend to lower correlations.
Environment with lower average correlations
Markets with lower average correlations are healthier for two reasons, argues Nicholas Colas, chief market strategist at Convergex. First, investors might allocate more capital to equities when the correlations between industry groups are lower. That’s because they’ll presumably consider overall portfolio volatility higher than if every sector is moving in sync. Second, lower correlations show that capital is likely flowing efficiently and will find the sector where a majority of investors sees the most upside potential.
Bottom line, investors may need patience. Convergex’s Colas summed up the situation: "First, declining correlations are one sign that equity markets are behaving more like the days before the financial crisis than almost any period since 2010. But we’ve seen this trend before, and hoped for it to continue, only to be disappointed."
links:
www.marketwatch.com/2017-02-10
Fama/French Research Portfolios (Status-Quo) http://mba.tuck.dartmouth.edu


