Related Categories
Related Articles
Articles
Why Investors may combine Value & Momentum Investing Strategies...
Many investors recognise that stand-alone value and momentum investment strategies have historically worked. Of course, these strategies don't work all the time and can also have long streaks of bad performance. But...
...long-only value and momentum investing, while interesting, don't represent the most puzzling anomaly from financial research (the table above will be explained in more detail below !).
Let's ask a basic question: What happens when one examine long-only value and momentum investment portfolios? So others can replicate our results, we examine data from Ken French's website. Specifically, we examine the returns to the value-weight portfolio formed on Value (B/M = Book / Market) and the value-weight portfolio formed on Intermediate-Term Momentum for United States stocks.
The following chart shows the (!) most recent (!) comparison between the VALUE-Strategy versus the MOMENTUM-Strategy over the last 12 months as can be traced via two prominent ETFs (MTUM = Momentum-ETF vs RPV = Pure Value-ETF); Chart-period: last twelve months/1year-period:
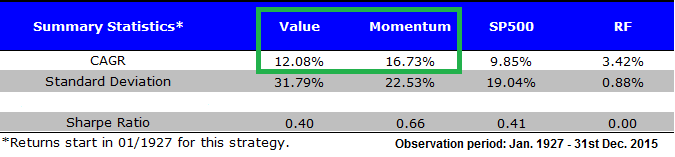
Now back to theoretic basics, we examine the returns from 1927-2015 for 4 portfolios:
Value: Top Decile of firms ranked on B/M from Ken French’s website. We use the value-weight portfolio returns.
Momentum: Top Decile of firms ranked on Intermediate-Term momentum (past 12 months excluding last month) from Ken French's website. We use the value-weight portfolio returns.
SP500: The total return to the S&P 500.
RF: Total return to the risk-free rate (taken from Ken French's website).
Results are gross of transaction costs and management fees. All returns are total returns and include the reinvestment of distributions (e.g., dividends).
One clearly notices the outperformance over the past 88 year of value and momentum compared to the market (before fees).
Now let's examine the returns from 1927-2015 for this following 4 portfolios:
50% Value, 50% Momentum: A strategy that invests 50% in the Value portfolio and 50% in the Momentum portfolio described below. We assume the investor rebalances the portfolio to 50%/50% every month.
Value: Top Decile of firms ranked on B/M from Ken French’s website. We use the value-weight portfolio returns.
Momentum: Top Decile of firms ranked on Intermediate-Term momentum (past 12 months excluding last month) from Ken French's website. We use the value-weight portfolio returns.
SP500: The total return to the S&P 500.
Results are gross of transaction costs and management fees. All returns are total returns and include the reinvestment of distributions (e.g., dividends).
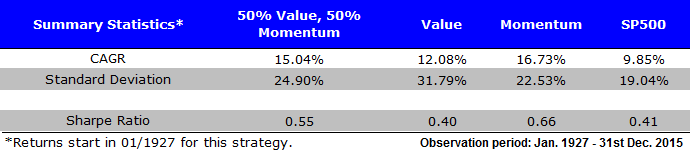
The evidence suggests that a value and momentum investing system, which combines both pure value and pure momentum into a single portfolio, may prevent a value-only investor or a momentum-only investor from suffering through extended, long-term stretches of poor performance. Of course, not all pain can be erased, and investors must always be aware that they should expect to endure sustained stretches of volatility and relative underperformance, even with a globally diversified value and momentum equity portfolio. Nothing in life is easy, especially when it comes to investing!
REMINDER:
As many remember, momentum did well in the internet bubble, and poorly thereafter. Similarly, Value did well in 2014, but got crushed in 2015. Bottomline: combining value and momentum helps manage long stretches of underperformance.
TIMING good idea?? well...
Despite the clear benefits of maintaining roughly static exposures to both value and momentum, readers always ask us if there is a way to "time" the factors. We think this is a risky proposition at the outset, because we give up a "bird in the hand" in the form of a well-established diversification benefit, to take on a "potential bird in the bush" benefit of capturing some extra returns by timing across value and momentum. We present the data below on the most common concept people ask us to test.
A simple idea is the following - keep a track of the total return to Value and Momentum over the past 12 months, and whichever factor has done better, allocate more to that factor. In other words, we can deploy a basic relative-strength rule across the two portfolios.
To test this idea, we examine the returns from 1928-2015 for 4 portfolios (Note we lose 1927 as we need to compute the 12-month return during this year):
50% Value, 50% Momentum: A strategy that invests 50% in the Value portfolio and 50% in the Momentum portfolio described above. We assume the investor rebalances the portfolio to 50%/50% every month.
Relative Strength (25%, 75%): Based on the past 12 months total return to Value and Momentum, every month this portfolio invests 75% in the strategy (Value or Momentum) with the higher past 12 months return, and 25% in the strategy (Value or Momentum) with the lower past 12 months return. We assume the investor rebalances the portfolio every month.
Relative Strength (0%, 100%): Based on the past 12 months total return to Value and Momentum, every month this portfolio invests 100% in the strategy (Value or Momentum) with the higher past 12 months return, and 0% in the strategy (Value or Momentum) with the lower past 12 months return. (Here) we assume the investor rebalances the portfolio every month.
SP500: The total return to the S&P 500.
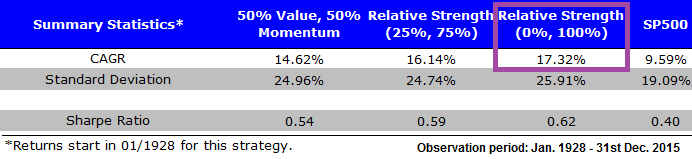 Results are gross of transaction costs and management fees. All returns are total returns and include the reinvestment of distributions (e.g., dividends).
The 50/50 portfolio, which always captures the diversification benefits of value and momentum, can be improved at the margin by using relative momentum across the two portfolios. However, there are (1) small costs of switching back and forth between the factors and (2) possible tax implications of making a 100% switch from value to momentum (or vice versa).
Big picture - a static value and momentum portfolio has known diversification benefits, as one factor tends to work well when the other factor is performing poorly. If one attempts to "time" factors, relative strength is a decent idea.
DISCLAIMER:
Active equity investing really isn't that complicated,
but it sure isn't easy.


